|
Download Data (XLS File) |

|
||||||||
 |
||||||||
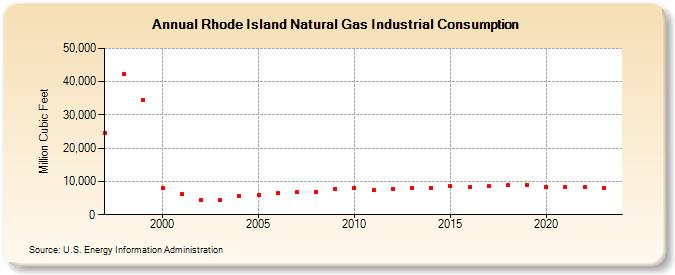
| Rhode Island Natural Gas Industrial Consumption (Million Cubic Feet) | ||||||||
| Decade | Year-0 | Year-1 | Year-2 | Year-3 | Year-4 | Year-5 | Year-6 | Year-7 | Year-8 | Year-9 |
|---|---|---|---|---|---|---|---|---|---|---|
| 1990's | 24,472 | 42,278 | 34,521 | |||||||
| 2000's | 8,039 | 6,127 | 4,455 | 4,450 | 5,530 | 5,892 | 6,395 | 6,705 | 6,775 | 7,739 |
| 2010's | 8,033 | 7,462 | 7,841 | 8,161 | 8,008 | 8,624 | 8,474 | 8,551 | 8,817 | 8,819 |
| 2020's | 8,361 | 8,458 | 8,370 | 8,161 | NA |
| - = No Data Reported; -- = Not Applicable; NA = Not Available; W = Withheld to avoid disclosure of individual company data. |
| Release Date: 1/31/2025 |
| Next Release Date: 2/28/2025 |