|
Download Data (XLS File) |

|
||||||||
 |
||||||||
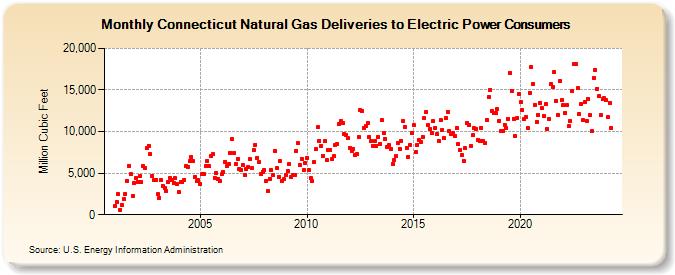
| Connecticut Natural Gas Deliveries to Electric Power Consumers (Million Cubic Feet) | ||||||||
| Year | Jan | Feb | Mar | Apr | May | Jun | Jul | Aug | Sep | Oct | Nov | Dec |
|---|---|---|---|---|---|---|---|---|---|---|---|---|
| 2001 | 1,038 | 1,552 | 2,452 | 614 | 1,179 | 1,891 | 2,476 | 4,089 | 5,913 | 4,880 | 2,279 | 3,798 |
| 2002 | 4,423 | 3,978 | 4,703 | 3,922 | 5,828 | 5,560 | 7,982 | 8,302 | 7,282 | 4,687 | 4,165 | 4,227 |
| 2003 | 2,459 | 2,060 | 4,165 | 3,486 | 3,226 | 2,869 | 3,891 | 4,415 | 4,211 | 3,757 | 4,363 | 3,666 |
| 2004 | 2,696 | 3,977 | 3,888 | 4,214 | 5,821 | 5,783 | 6,418 | 6,918 | 6,399 | 4,556 | 4,045 | 4,120 |
| 2005 | 3,669 | 4,923 | 4,944 | 5,869 | 6,517 | 5,807 | 7,102 | 7,254 | 4,431 | 5,023 | 4,341 | 4,017 |
| 2006 | 4,858 | 5,132 | 6,381 | 5,822 | 6,143 | 7,470 | 9,048 | 7,397 | 6,099 | 6,758 | 5,533 | 5,382 |
| 2007 | 5,951 | 4,813 | 5,493 | 5,756 | 6,656 | 5,571 | 7,749 | 8,424 | 6,859 | 6,305 | 4,892 | 5,158 |
| 2008 | 5,378 | 4,108 | 2,868 | 4,311 | 5,322 | 4,726 | 7,682 | 5,594 | 4,549 | 6,454 | 4,108 | 4,253 |
| 2009 | 4,789 | 5,283 | 6,042 | 4,560 | 4,788 | 4,755 | 7,714 | 8,600 | 5,934 | 6,754 | 5,373 | 6,272 |
| 2010 | 6,840 | 5,366 | 4,381 | 4,079 | 6,385 | 7,849 | 10,500 | 8,895 | 8,296 | 7,094 | 8,856 | 6,603 |
| 2011 | 7,741 | 7,819 | 6,728 | 7,009 | 8,420 | 8,473 | 10,960 | 11,246 | 11,012 | 9,731 | 9,586 | 9,172 |
| 2012 | 8,057 | 7,632 | 7,960 | 7,155 | 7,310 | 9,356 | 12,599 | 12,490 | 10,483 | 10,622 | 11,042 | 9,348 |
| 2013 | 8,810 | 8,267 | 8,889 | 8,294 | 9,382 | 8,499 | 11,365 | 9,792 | 9,148 | 8,099 | 8,365 | 7,952 |
| 2014 | 6,081 | 6,610 | 7,025 | 8,610 | 7,959 | 8,922 | 11,242 | 10,589 | 8,075 | 6,987 | 8,423 | 9,836 |
| 2015 | 10,732 | 7,533 | 8,418 | 8,933 | 8,759 | 9,399 | 11,634 | 12,406 | 10,733 | 10,315 | 9,833 | 11,213 |
| 2016 | 10,479 | 9,694 | 8,897 | 11,368 | 10,245 | 9,199 | 11,628 | 12,376 | 10,069 | 9,718 | 9,848 | 9,504 |
| 2017 | 10,437 | 8,451 | 7,841 | 7,162 | 6,500 | 7,981 | 10,987 | 10,765 | 8,307 | 9,549 | 10,392 | 10,315 |
| 2018 | 9,029 | 8,891 | 10,459 | 8,846 | 8,641 | 11,424 | 14,127 | 15,046 | 12,458 | 12,239 | 12,245 | 12,669 |
| 2019 | 11,300 | 10,093 | 10,090 | 10,842 | 10,430 | 11,542 | 17,085 | 14,916 | 11,540 | 9,412 | 11,655 | 14,545 |
| 2020 | 13,503 | 12,562 | 11,459 | 11,774 | 10,414 | 14,684 | 17,796 | 15,733 | 13,244 | 11,161 | 12,042 | 13,487 |
| 2021 | 12,780 | 11,856 | 13,284 | 10,261 | 11,528 | 15,717 | 15,383 | 17,172 | 13,723 | 12,012 | 16,033 | 13,746 |
| 2022 | 12,962 | 12,366 | 13,427 | 10,701 | 11,423 | 14,596 | 17,984 | 18,317 | 15,414 | 12,385 | 13,455 | 11,605 |
| 2023 | 13,554 | 11,299 | 13,953 | 11,946 | 10,010 | 16,448 | 17,380 | 15,176 | 14,231 | 11,944 | 13,910 | 13,992 |
| 2024 | 13,893 | 11,833 | 13,765 | 10,770 | 11,477 | 15,282 | 18,908 | 18,000 | 15,683 | 15,006 | 15,691 | 15,605 |
| 2025 | 14,069 | |||||||||||
| - = No Data Reported; -- = Not Applicable; NA = Not Available; W = Withheld to avoid disclosure of individual company data. |
| Release Date: 3/31/2025 |
| Next Release Date: 4/30/2025 |