|
Download Data (XLS File) |

|
||||||||
 |
||||||||
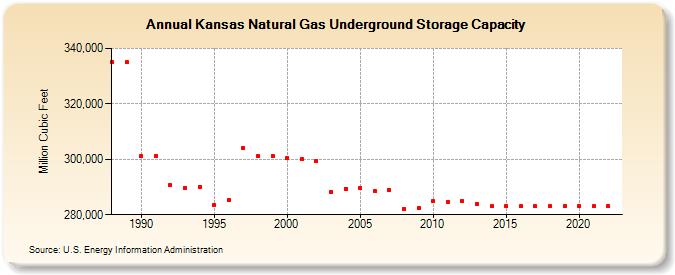
| Kansas Natural Gas Underground Storage Capacity (Million Cubic Feet) | ||||||||
| Decade | Year-0 | Year-1 | Year-2 | Year-3 | Year-4 | Year-5 | Year-6 | Year-7 | Year-8 | Year-9 |
|---|---|---|---|---|---|---|---|---|---|---|
| 1980's | 334,925 | 334,925 | ||||||||
| 1990's | 301,199 | 301,199 | 290,571 | 289,797 | 290,148 | 283,603 | 285,201 | 304,065 | 301,101 | 301,101 |
| 2000's | 300,401 | 300,000 | 299,473 | 288,197 | 289,450 | 289,747 | 288,383 | 288,926 | 282,221 | 282,300 |
| 2010's | 284,821 | 284,731 | 284,905 | 283,974 | 282,984 | 282,984 | 282,986 | 282,986 | 282,986 | 282,986 |
| 2020's | 282,986 | 282,986 | 282,986 | 282,986 |
| - = No Data Reported; -- = Not Applicable; NA = Not Available; W = Withheld to avoid disclosure of individual company data. |
| Release Date: 1/31/2025 |
| Next Release Date: 2/28/2025 |