|
Download Data (XLS File) |

|
||||||||
 |
||||||||
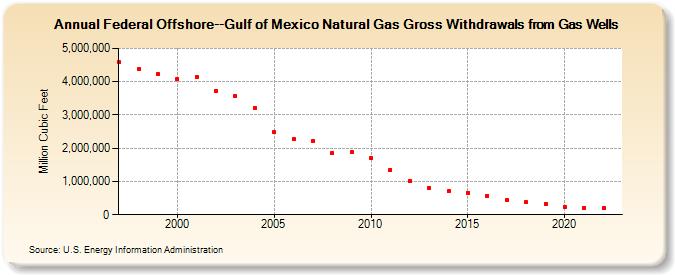
| Federal Offshore--Gulf of America Natural Gas Gross Withdrawals from Gas Wells (Million Cubic Feet) | ||||||||
| Decade | Year-0 | Year-1 | Year-2 | Year-3 | Year-4 | Year-5 | Year-6 | Year-7 | Year-8 | Year-9 |
|---|---|---|---|---|---|---|---|---|---|---|
| 1990's | 4,582,092 | 4,377,057 | 4,222,677 | |||||||
| 2000's | 4,085,358 | 4,143,080 | 3,719,169 | 3,563,883 | 3,213,638 | 2,473,392 | 2,270,575 | 2,202,242 | 1,848,290 | 1,877,722 |
| 2010's | 1,699,908 | 1,353,929 | 1,013,914 | 817,340 | 706,715 | 667,785 | 573,028 | 454,672 | 372,429 | 336,890 |
| 2020's | 236,929 | 209,869 | 205,042 | 147,948 |
| - = No Data Reported; -- = Not Applicable; NA = Not Available; W = Withheld to avoid disclosure of individual company data. |
| Release Date: 1/31/2025 |
| Next Release Date: 2/28/2025 |