|
Download Data (XLS File) |

|
||||||||
 |
||||||||
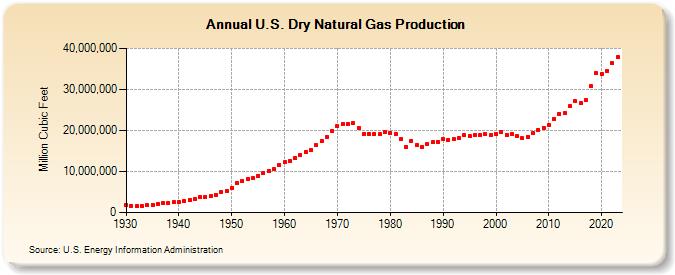
| U.S. Dry Natural Gas Production (Million Cubic Feet) | ||||||||
| Decade | Year-0 | Year-1 | Year-2 | Year-3 | Year-4 | Year-5 | Year-6 | Year-7 | Year-8 | Year-9 |
|---|---|---|---|---|---|---|---|---|---|---|
| 1930's | 1,903,771 | 1,659,614 | 1,541,982 | 1,548,393 | 1,763,606 | 1,913,475 | 2,164,413 | 2,403,273 | 2,284,863 | 2,464,637 |
| 1940's | 2,654,293 | 2,778,061 | 3,026,694 | 3,393,743 | 3,672,156 | 3,882,066 | 3,987,488 | 4,393,439 | 4,938,512 | 5,195,404 |
| 1950's | 6,022,198 | 7,164,959 | 7,694,299 | 8,056,848 | 8,388,198 | 9,028,665 | 9,663,910 | 10,246,622 | 10,572,208 | 11,547,658 |
| 1960's | 12,228,148 | 12,661,579 | 13,253,006 | 14,076,412 | 14,824,027 | 15,286,280 | 16,467,320 | 17,386,791 | 18,494,523 | 19,831,680 |
| 1970's | 21,014,229 | 21,609,885 | 21,623,705 | 21,730,998 | 20,713,032 | 19,236,379 | 19,098,352 | 19,162,900 | 19,121,903 | 19,663,415 |
| 1980's | 19,403,119 | 19,181,261 | 17,820,057 | 16,094,463 | 17,466,477 | 16,453,853 | 16,059,030 | 16,620,581 | 17,102,621 | 17,310,645 |
| 1990's | 17,809,674 | 17,697,802 | 17,839,903 | 18,095,460 | 18,821,025 | 18,598,679 | 18,854,063 | 18,902,389 | 19,023,564 | 18,832,232 |
| 2000's | 19,181,980 | 19,616,311 | 18,927,788 | 19,098,544 | 18,590,891 | 18,050,598 | 18,503,605 | 19,266,026 | 20,158,602 | 20,623,854 |
| 2010's | 21,315,507 | 22,901,879 | 24,033,266 | 24,205,523 | 25,889,605 | 27,065,460 | 26,592,115 | 27,340,583 | 30,774,274 | 33,899,021 |
| 2020's | 33,811,129 | 34,529,276 | 36,353,023 | 37,803,268 |
| - = No Data Reported; -- = Not Applicable; NA = Not Available; W = Withheld to avoid disclosure of individual company data. |
| Release Date: 11/29/2024 |
| Next Release Date: 12/31/2024 |