|
Download Data (XLS File) |

|
||||||||
 |
||||||||
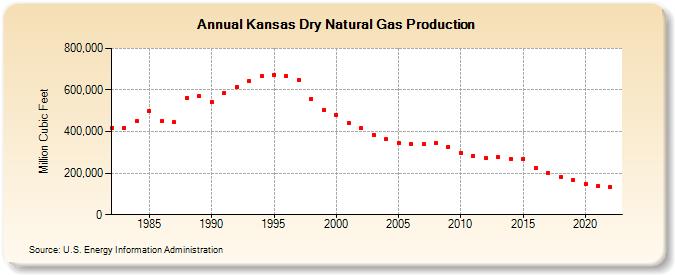
| Kansas Dry Natural Gas Production (Million Cubic Feet) | ||||||||
| Decade | Year-0 | Year-1 | Year-2 | Year-3 | Year-4 | Year-5 | Year-6 | Year-7 | Year-8 | Year-9 |
|---|---|---|---|---|---|---|---|---|---|---|
| 1980's | 417,928 | 418,646 | 450,504 | 499,068 | 451,913 | 444,355 | 563,045 | 570,923 | ||
| 1990's | 543,961 | 586,611 | 615,274 | 642,333 | 665,794 | 673,994 | 664,800 | 648,991 | 557,785 | 505,312 |
| 2000's | 481,529 | 441,628 | 415,705 | 384,169 | 362,548 | 345,708 | 340,318 | 337,814 | 346,008 | 327,492 |
| 2010's | 298,469 | 283,320 | 275,080 | 277,022 | 269,965 | 269,128 | 226,890 | 201,018 | 182,549 | 167,606 |
| 2020's | 149,312 | 139,121 | 134,045 | 123,581 |
| - = No Data Reported; -- = Not Applicable; NA = Not Available; W = Withheld to avoid disclosure of individual company data. |
| Release Date: 11/29/2024 |
| Next Release Date: 12/31/2024 |