|
Download Data (XLS File) |

|
|||||
 |
|||||
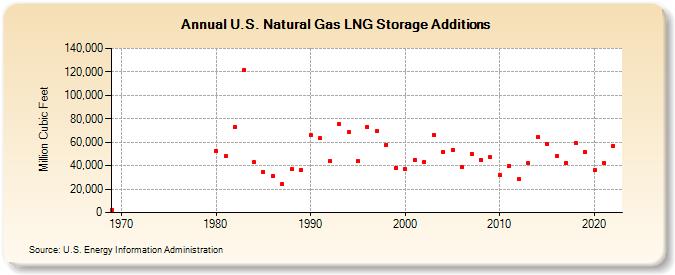
| U.S. Natural Gas LNG Storage Additions (Million Cubic Feet) | |||||
| Decade | Year-0 | Year-1 | Year-2 | Year-3 | Year-4 | Year-5 | Year-6 | Year-7 | Year-8 | Year-9 |
|---|---|---|---|---|---|---|---|---|---|---|
| 1960's | 2,581 | |||||||||
| 1980's | 52,780 | 47,839 | 73,028 | 121,928 | 42,791 | 34,671 | 31,500 | 24,379 | 36,949 | 36,467 |
| 1990's | 65,814 | 63,259 | 44,033 | 75,217 | 68,478 | 43,897 | 73,057 | 69,865 | 57,887 | 38,333 |
| 2000's | 36,869 | 45,210 | 43,504 | 66,162 | 51,956 | 53,444 | 38,706 | 50,180 | 45,060 | 47,096 |
| 2010's | 32,205 | 39,999 | 28,445 | 41,961 | 64,615 | 58,812 | 47,808 | 42,613 | 59,702 | 51,483 |
| 2020's | 36,003 | 42,565 | 58,312 | 49,805 | 44,470 |
| - = No Data Reported; -- = Not Applicable; NA = Not Available; W = Withheld to avoid disclosure of individual company data. |
| Release Date: 11/28/2025 |
| Next Release Date: 12/31/2025 |