|
Download Data (XLS File) |

|
|||||
 |
|||||
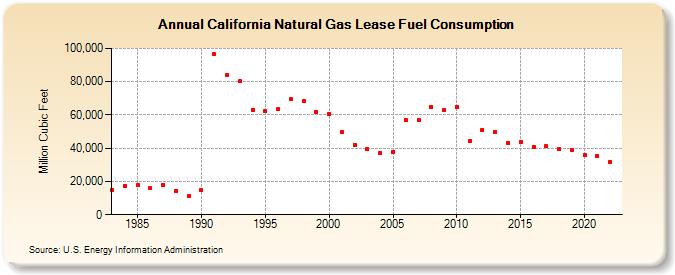
| California Natural Gas Lease Fuel Consumption (Million Cubic Feet) | |||||
| Decade | Year-0 | Year-1 | Year-2 | Year-3 | Year-4 | Year-5 | Year-6 | Year-7 | Year-8 | Year-9 |
|---|---|---|---|---|---|---|---|---|---|---|
| 1980's | 14,569 | 17,498 | 17,575 | 15,868 | 18,066 | 14,370 | 11,065 | |||
| 1990's | 14,754 | 96,442 | 84,220 | 80,210 | 63,251 | 62,160 | 63,297 | 69,386 | 68,370 | 61,810 |
| 2000's | 60,757 | 49,766 | 41,878 | 39,452 | 37,337 | 37,865 | 57,234 | 56,936 | 64,689 | 63,127 |
| 2010's | 64,931 | 44,379 | 51,154 | 49,846 | 42,989 | 43,838 | 40,830 | 41,146 | 39,720 | 38,789 |
| 2020's | 35,681 | 35,254 | 31,658 | 34,015 |
| - = No Data Reported; -- = Not Applicable; NA = Not Available; W = Withheld to avoid disclosure of individual company data. |
| Release Date: 3/31/2025 |
| Next Release Date: 4/30/2025 |