|
Download Data (XLS File) |
|
||||||||
|
||||||||
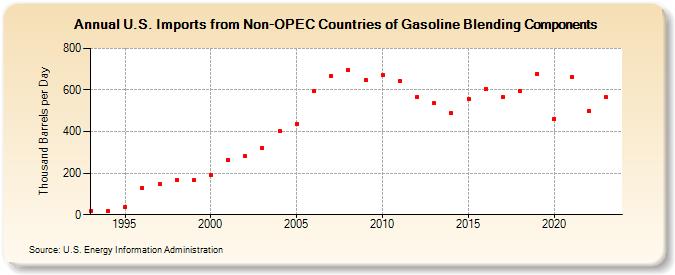
| U.S. Imports from Non-OPEC Countries of Gasoline Blending Components (Thousand Barrels per Day) | ||||||||
| Decade | Year-0 | Year-1 | Year-2 | Year-3 | Year-4 | Year-5 | Year-6 | Year-7 | Year-8 | Year-9 |
|---|---|---|---|---|---|---|---|---|---|---|
| 1990's | 18 | 17 | 38 | 130 | 146 | 167 | 166 | |||
| 2000's | 189 | 265 | 281 | 323 | 401 | 436 | 594 | 668 | 695 | 649 |
| 2010's | 670 | 642 | 568 | 536 | 488 | 556 | 606 | 564 | 594 | 679 |
| 2020's | 462 | 663 | 500 | 565 |
| - = No Data Reported; -- = Not Applicable; NA = Not Available; W = Withheld to avoid disclosure of individual company data. |
| Release Date: 7/31/2024 |
| Next Release Date: 8/30/2024 |