|
Download Data (XLS File) |
|
||||||||
|
||||||||
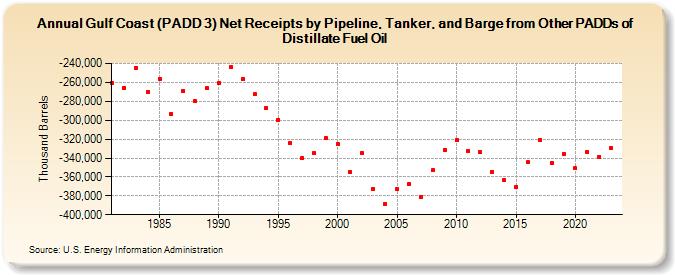
| Gulf Coast (PADD 3) Net Receipts by Pipeline, Tanker, and Barge from Other PADDs of Distillate Fuel Oil (Thousand Barrels) | ||||||||
| Decade | Year-0 | Year-1 | Year-2 | Year-3 | Year-4 | Year-5 | Year-6 | Year-7 | Year-8 | Year-9 |
|---|---|---|---|---|---|---|---|---|---|---|
| 1980's | -260,481 | -265,628 | -244,587 | -269,667 | -255,903 | -293,003 | -269,127 | -279,986 | -266,368 | |
| 1990's | -260,594 | -243,703 | -256,390 | -272,646 | -287,264 | -299,310 | -324,642 | -340,083 | -334,661 | -319,156 |
| 2000's | -325,157 | -354,649 | -335,015 | -372,663 | -388,823 | -373,063 | -367,478 | -380,796 | -353,186 | -331,424 |
| 2010's | -320,980 | -332,413 | -334,083 | -354,604 | -362,760 | -370,289 | -344,606 | -320,817 | -345,495 | -335,849 |
| 2020's | -351,090 | -333,744 | -338,588 | -328,981 |
| - = No Data Reported; -- = Not Applicable; NA = Not Available; W = Withheld to avoid disclosure of individual company data. |
| Release Date: 7/31/2024 |
| Next Release Date: 8/30/2024 |