|
Download Data (XLS File) |
|
||||||||
|
||||||||
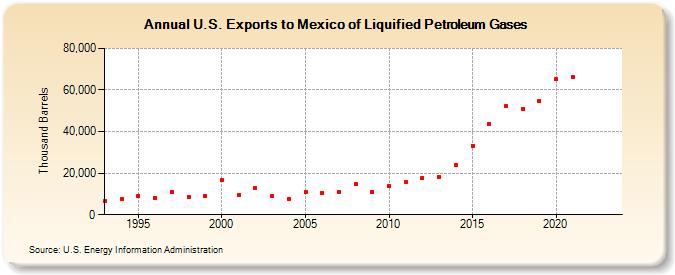
| U.S. Exports to Mexico of Liquified Petroleum Gases (Thousand Barrels) | ||||||||
| Decade | Year-0 | Year-1 | Year-2 | Year-3 | Year-4 | Year-5 | Year-6 | Year-7 | Year-8 | Year-9 |
|---|---|---|---|---|---|---|---|---|---|---|
| 1990's | 6,568 | 7,544 | 9,132 | 8,263 | 10,887 | 8,553 | 8,987 | |||
| 2000's | 16,787 | 9,362 | 12,799 | 8,966 | 7,655 | 10,916 | 10,614 | 11,118 | 14,795 | 11,005 |
| 2010's | 13,785 | 15,842 | 17,886 | 18,348 | 24,025 | 33,173 | 43,643 | 52,050 | 50,979 | 54,761 |
| 2020's | 65,137 | 66,129 | -- | -- |
| - = No Data Reported; -- = Not Applicable; NA = Not Available; W = Withheld to avoid disclosure of individual company data. |
| Release Date: 8/30/2024 |
| Next Release Date: 8/29/2025 |