|
Download Data (XLS File) |
|
||||||||
|
||||||||
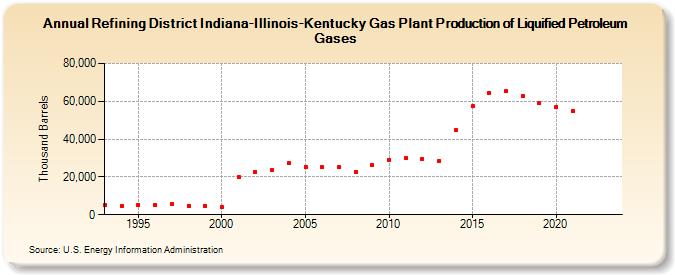
| Refining District Indiana-Illinois-Kentucky Gas Plant Production of Liquified Petroleum Gases (Thousand Barrels) | ||||||||
| Decade | Year-0 | Year-1 | Year-2 | Year-3 | Year-4 | Year-5 | Year-6 | Year-7 | Year-8 | Year-9 |
|---|---|---|---|---|---|---|---|---|---|---|
| 1990's | 5,342 | 4,847 | 5,020 | 5,093 | 5,539 | 4,821 | 4,677 | |||
| 2000's | 4,093 | 20,024 | 22,684 | 23,799 | 27,147 | 25,503 | 25,255 | 24,989 | 22,849 | 26,063 |
| 2010's | 28,950 | 30,092 | 29,346 | 28,515 | 44,859 | 57,261 | 64,336 | 65,302 | 62,748 | 58,885 |
| 2020's | 57,180 | 54,756 | -- | -- |
| - = No Data Reported; -- = Not Applicable; NA = Not Available; W = Withheld to avoid disclosure of individual company data. |
| Release Date: 6/28/2024 |
| Next Release Date: 8/30/2024 |