|
Download Data (XLS File) |
|
||||||||
|
||||||||
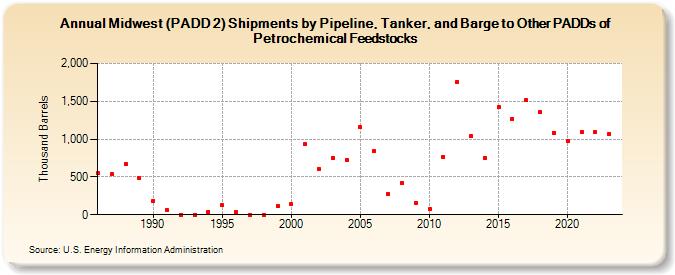
| Midwest (PADD 2) Shipments by Pipeline, Tanker, and Barge to Other PADDs of Petrochemical Feedstocks (Thousand Barrels) | ||||||||
| Decade | Year-0 | Year-1 | Year-2 | Year-3 | Year-4 | Year-5 | Year-6 | Year-7 | Year-8 | Year-9 |
|---|---|---|---|---|---|---|---|---|---|---|
| 1980's | 547 | 535 | 668 | 485 | ||||||
| 1990's | 183 | 60 | 0 | 0 | 41 | 122 | 40 | 0 | 0 | 117 |
| 2000's | 137 | 932 | 605 | 750 | 730 | 1,158 | 842 | 276 | 421 | 161 |
| 2010's | 76 | 769 | 1,758 | 1,038 | 749 | 1,423 | 1,267 | 1,516 | 1,358 | 1,085 |
| 2020's | 978 | 1,097 | 1,093 | 1,073 |
| - = No Data Reported; -- = Not Applicable; NA = Not Available; W = Withheld to avoid disclosure of individual company data. |
| Release Date: 6/28/2024 |
| Next Release Date: 8/30/2024 |