|
Download Data (XLS File) |
|
||||||||
|
||||||||
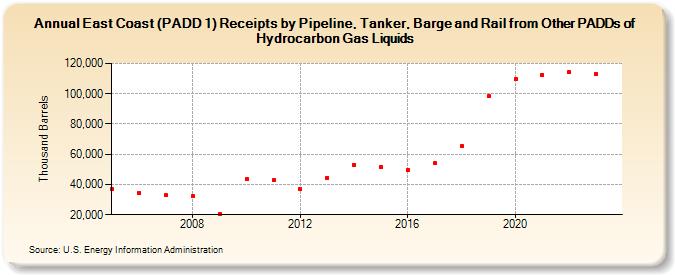
| East Coast (PADD 1) Receipts by Pipeline, Tanker, Barge and Rail from Other PADDs of Hydrocarbon Gas Liquids (Thousand Barrels) | ||||||||
| Decade | Year-0 | Year-1 | Year-2 | Year-3 | Year-4 | Year-5 | Year-6 | Year-7 | Year-8 | Year-9 |
|---|---|---|---|---|---|---|---|---|---|---|
| 2000's | 37,139 | 34,435 | 32,846 | 32,207 | 20,550 | |||||
| 2010's | 43,410 | 42,820 | 36,892 | 44,593 | 53,167 | 51,708 | 49,678 | 54,154 | 65,288 | 98,293 |
| 2020's | 109,417 | 112,511 | 114,196 | 113,114 |
| - = No Data Reported; -- = Not Applicable; NA = Not Available; W = Withheld to avoid disclosure of individual company data. |
| Release Date: 6/28/2024 |
| Next Release Date: 8/30/2024 |
Referring Pages: