|
Download Data (XLS File) |
|
||||||||
|
||||||||
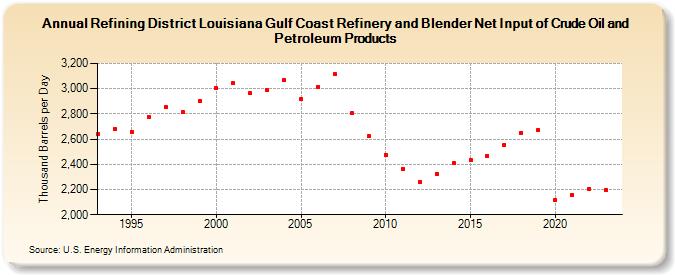
| Refining District Louisiana Gulf Coast Refinery and Blender Net Input of Crude Oil and Petroleum Products (Thousand Barrels per Day) | ||||||||
| Decade | Year-0 | Year-1 | Year-2 | Year-3 | Year-4 | Year-5 | Year-6 | Year-7 | Year-8 | Year-9 |
|---|---|---|---|---|---|---|---|---|---|---|
| 1990's | 2,642 | 2,682 | 2,660 | 2,777 | 2,854 | 2,813 | 2,901 | |||
| 2000's | 3,004 | 3,043 | 2,963 | 2,988 | 3,068 | 2,920 | 3,017 | 3,115 | 2,804 | 2,623 |
| 2010's | 2,477 | 2,361 | 2,263 | 2,326 | 2,407 | 2,435 | 2,468 | 2,555 | 2,652 | 2,673 |
| 2020's | 2,113 | 2,160 | 2,208 | 2,201 |
| - = No Data Reported; -- = Not Applicable; NA = Not Available; W = Withheld to avoid disclosure of individual company data. |
| Release Date: 8/30/2024 |
| Next Release Date: 8/29/2025 |