|
Download Data (XLS File) |
|
||||||||
|
||||||||
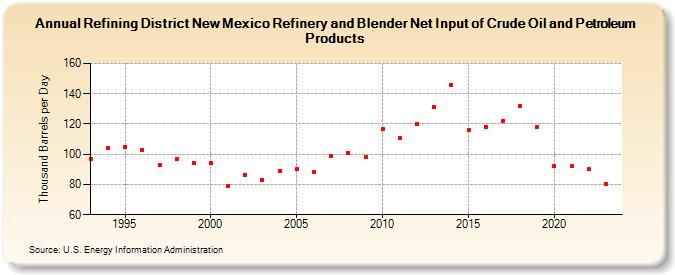
| Refining District New Mexico Refinery and Blender Net Input of Crude Oil and Petroleum Products (Thousand Barrels per Day) | ||||||||
| Decade | Year-0 | Year-1 | Year-2 | Year-3 | Year-4 | Year-5 | Year-6 | Year-7 | Year-8 | Year-9 |
|---|---|---|---|---|---|---|---|---|---|---|
| 1990's | 97 | 104 | 105 | 103 | 93 | 97 | 94 | |||
| 2000's | 94 | 79 | 86 | 83 | 89 | 90 | 88 | 99 | 101 | 98 |
| 2010's | 117 | 111 | 120 | 131 | 146 | 116 | 118 | 122 | 132 | 118 |
| 2020's | 92 | 92 | 90 | 80 |
| - = No Data Reported; -- = Not Applicable; NA = Not Available; W = Withheld to avoid disclosure of individual company data. |
| Release Date: 8/30/2024 |
| Next Release Date: 8/29/2025 |