|
Download Data (XLS File) |
|
||||||||
|
||||||||
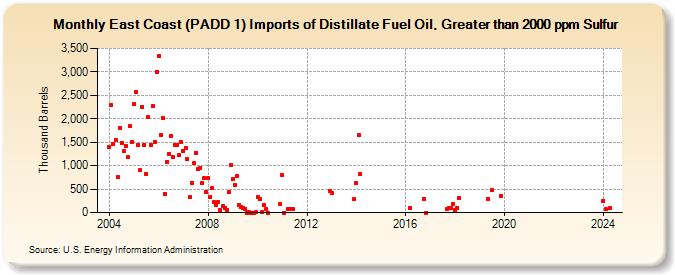
| East Coast (PADD 1) Imports of Distillate Fuel Oil, Greater than 2000 ppm Sulfur (Thousand Barrels) | ||||||||
| Year | Jan | Feb | Mar | Apr | May | Jun | Jul | Aug | Sep | Oct | Nov | Dec |
|---|---|---|---|---|---|---|---|---|---|---|---|---|
| 2004 | 1,389 | 2,290 | 1,453 | 1,554 | 758 | 1,813 | 1,488 | 1,313 | 1,427 | 1,185 | 1,839 | 1,495 |
| 2005 | 2,321 | 2,578 | 1,449 | 900 | 2,258 | 1,448 | 832 | 2,035 | 1,450 | 2,271 | 1,509 | 3,000 |
| 2006 | 3,337 | 1,654 | 2,012 | 403 | 1,084 | 1,249 | 1,628 | 1,178 | 1,451 | 1,447 | 1,221 | 1,503 |
| 2007 | 1,320 | 1,383 | 1,138 | 325 | 627 | 1,061 | 1,277 | 924 | 946 | 632 | 730 | 446 |
| 2008 | 734 | 337 | 522 | 225 | 161 | 234 | 50 | 137 | 101 | 56 | 428 | 1,016 |
| 2009 | 726 | 585 | 782 | 168 | 112 | 101 | 74 | 1 | 2 | 1 | 1 | 4 |
| 2010 | 335 | 292 | 3 | 162 | 75 | 1 | 190 | |||||
| 2011 | 805 | 1 | 72 | 83 | 79 | |||||||
| 2012 | 463 | |||||||||||
| 2013 | 422 | 292 | ||||||||||
| 2014 | 639 | 1,649 | 813 | |||||||||
| 2016 | 100 | 293 | 0 | |||||||||
| 2017 | 83 | 97 | 95 | 193 | ||||||||
| 2018 | 50 | 100 | 300 | |||||||||
| 2019 | 288 | 481 | 363 | |||||||||
| 2024 | 252 | 71 | 90 | |||||||||
| - = No Data Reported; -- = Not Applicable; NA = Not Available; W = Withheld to avoid disclosure of individual company data. |
| Release Date: 8/30/2024 |
| Next Release Date: 9/30/2024 |