|
Download Data (XLS File) |
|
||||||||
|
||||||||
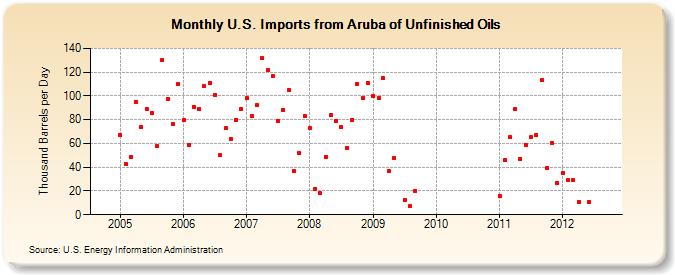
| U.S. Imports from Aruba of Unfinished Oils (Thousand Barrels per Day) | ||||||||
| Year | Jan | Feb | Mar | Apr | May | Jun | Jul | Aug | Sep | Oct | Nov | Dec |
|---|---|---|---|---|---|---|---|---|---|---|---|---|
| 2005 | 67 | 43 | 49 | 95 | 74 | 89 | 86 | 58 | 130 | 97 | 76 | 110 |
| 2006 | 80 | 59 | 91 | 89 | 108 | 111 | 101 | 50 | 73 | 64 | 80 | 89 |
| 2007 | 98 | 83 | 92 | 132 | 122 | 117 | 79 | 88 | 105 | 37 | 52 | 83 |
| 2008 | 73 | 22 | 18 | 49 | 84 | 79 | 74 | 56 | 80 | 110 | 98 | 111 |
| 2009 | 100 | 98 | 115 | 37 | 48 | 12 | 7 | 20 | ||||
| 2011 | 16 | 46 | 65 | 89 | 47 | 59 | 65 | 67 | 113 | 39 | 60 | 27 |
| 2012 | 35 | 29 | 29 | 11 | 11 | |||||||
| - = No Data Reported; -- = Not Applicable; NA = Not Available; W = Withheld to avoid disclosure of individual company data. |
| Release Date: 7/31/2024 |
| Next Release Date: 8/30/2024 |