|
Download Data (XLS File) |
|
||||||||
|
||||||||
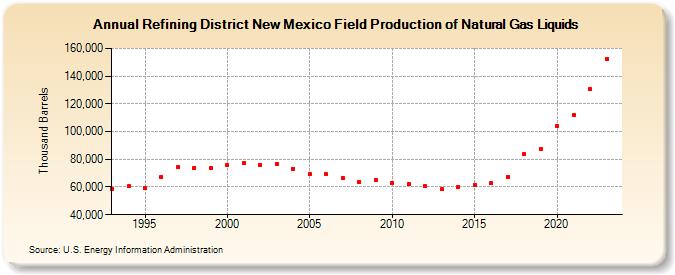
| Refining District New Mexico Field Production of Natural Gas Liquids (Thousand Barrels) | ||||||||
| Decade | Year-0 | Year-1 | Year-2 | Year-3 | Year-4 | Year-5 | Year-6 | Year-7 | Year-8 | Year-9 |
|---|---|---|---|---|---|---|---|---|---|---|
| 1990's | 58,628 | 60,468 | 59,131 | 67,197 | 74,411 | 73,920 | 73,480 | |||
| 2000's | 75,822 | 77,540 | 76,018 | 76,569 | 73,209 | 69,063 | 69,055 | 66,364 | 63,861 | 64,969 |
| 2010's | 62,973 | 62,226 | 60,396 | 58,237 | 60,287 | 61,501 | 62,602 | 67,426 | 83,824 | 87,198 |
| 2020's | 103,795 | 112,032 | 130,415 | 152,687 |
| - = No Data Reported; -- = Not Applicable; NA = Not Available; W = Withheld to avoid disclosure of individual company data. |
| Release Date: 6/28/2024 |
| Next Release Date: 8/30/2024 |