|
Download Data (XLS File) |
|
||||||||
|
||||||||
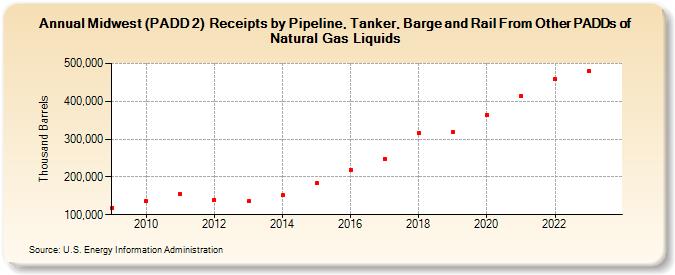
| Midwest (PADD 2) Receipts by Pipeline, Tanker, Barge and Rail From Other PADDs of Natural Gas Liquids (Thousand Barrels) | ||||||||
| Decade | Year-0 | Year-1 | Year-2 | Year-3 | Year-4 | Year-5 | Year-6 | Year-7 | Year-8 | Year-9 |
|---|---|---|---|---|---|---|---|---|---|---|
| 2000's | 118,034 | |||||||||
| 2010's | 136,724 | 154,973 | 138,993 | 135,079 | 151,160 | 182,695 | 219,557 | 248,131 | 316,062 | 317,913 |
| 2020's | 363,345 | 414,278 | 458,443 | 480,562 |
| - = No Data Reported; -- = Not Applicable; NA = Not Available; W = Withheld to avoid disclosure of individual company data. |
| Release Date: 6/28/2024 |
| Next Release Date: 8/30/2024 |