|
Download Data (XLS File) |
|
||||||||
|
||||||||
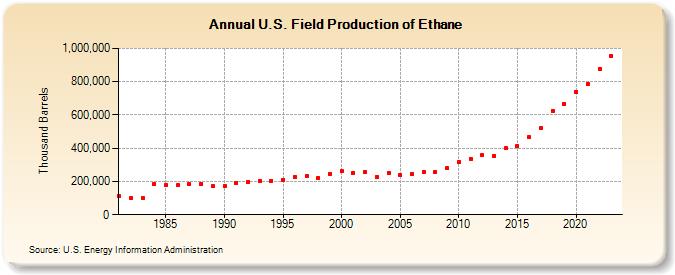
| U.S. Field Production of Ethane (Thousand Barrels) | ||||||||
| Decade | Year-0 | Year-1 | Year-2 | Year-3 | Year-4 | Year-5 | Year-6 | Year-7 | Year-8 | Year-9 |
|---|---|---|---|---|---|---|---|---|---|---|
| 1980's | 110,801 | 98,444 | 101,659 | 184,895 | 180,122 | 177,115 | 182,017 | 183,355 | 170,119 | |
| 1990's | 173,928 | 193,319 | 198,020 | 202,782 | 204,114 | 209,073 | 229,415 | 232,617 | 221,675 | 246,545 |
| 2000's | 262,597 | 252,746 | 255,415 | 228,298 | 251,215 | 236,885 | 246,794 | 258,682 | 256,713 | 280,590 |
| 2010's | 317,180 | 337,972 | 356,592 | 354,089 | 398,206 | 412,348 | 465,818 | 520,504 | 625,407 | 667,609 |
| 2020's | 737,847 | 784,486 | 878,012 | 956,689 |
| - = No Data Reported; -- = Not Applicable; NA = Not Available; W = Withheld to avoid disclosure of individual company data. |
| Release Date: 6/28/2024 |
| Next Release Date: 8/30/2024 |