|
Download Data (XLS File) |
|
||||||||
|
||||||||
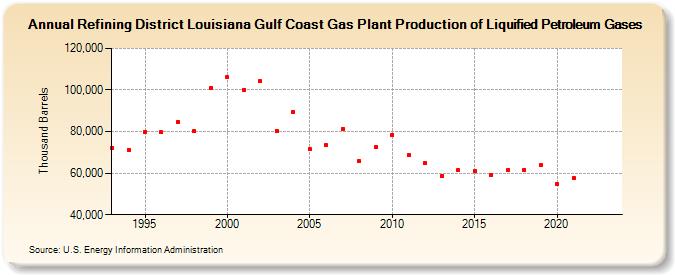
| Refining District Louisiana Gulf Coast Gas Plant Production of Liquified Petroleum Gases (Thousand Barrels) | ||||||||
| Decade | Year-0 | Year-1 | Year-2 | Year-3 | Year-4 | Year-5 | Year-6 | Year-7 | Year-8 | Year-9 |
|---|---|---|---|---|---|---|---|---|---|---|
| 1990's | 72,001 | 71,301 | 79,976 | 79,652 | 84,793 | 80,230 | 101,089 | |||
| 2000's | 106,074 | 100,135 | 104,147 | 80,413 | 89,472 | 71,420 | 73,383 | 81,440 | 65,774 | 72,395 |
| 2010's | 78,482 | 68,500 | 64,855 | 58,708 | 61,376 | 60,986 | 59,240 | 61,299 | 61,430 | 63,702 |
| 2020's | 54,686 | 57,683 | -- | -- |
| - = No Data Reported; -- = Not Applicable; NA = Not Available; W = Withheld to avoid disclosure of individual company data. |
| Release Date: 6/28/2024 |
| Next Release Date: 8/30/2024 |