|
Download Data (XLS File) |
|
||||||||
|
||||||||
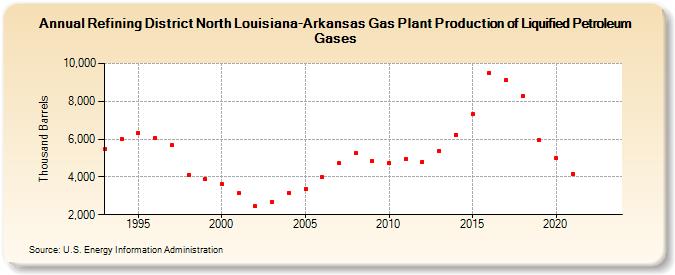
| Refining District North Louisiana-Arkansas Gas Plant Production of Liquified Petroleum Gases (Thousand Barrels) | ||||||||
| Decade | Year-0 | Year-1 | Year-2 | Year-3 | Year-4 | Year-5 | Year-6 | Year-7 | Year-8 | Year-9 |
|---|---|---|---|---|---|---|---|---|---|---|
| 1990's | 5,473 | 5,993 | 6,321 | 6,059 | 5,694 | 4,092 | 3,876 | |||
| 2000's | 3,628 | 3,131 | 2,436 | 2,688 | 3,168 | 3,350 | 3,978 | 4,732 | 5,266 | 4,855 |
| 2010's | 4,731 | 4,948 | 4,802 | 5,385 | 6,242 | 7,302 | 9,497 | 9,126 | 8,259 | 5,949 |
| 2020's | 4,980 | 4,161 | -- | -- |
| - = No Data Reported; -- = Not Applicable; NA = Not Available; W = Withheld to avoid disclosure of individual company data. |
| Release Date: 6/28/2024 |
| Next Release Date: 8/30/2024 |