|
Download Data (XLS File) |
|
||||||||
|
||||||||
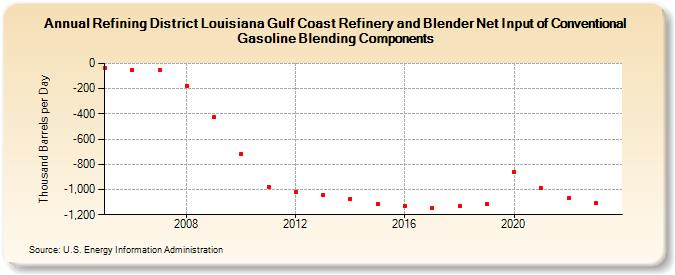
| Refining District Louisiana Gulf Coast Refinery and Blender Net Input of Conventional Gasoline Blending Components (Thousand Barrels per Day) | ||||||||
| Decade | Year-0 | Year-1 | Year-2 | Year-3 | Year-4 | Year-5 | Year-6 | Year-7 | Year-8 | Year-9 |
|---|---|---|---|---|---|---|---|---|---|---|
| 2000's | -32 | -52 | -52 | -175 | -425 | |||||
| 2010's | -715 | -979 | -1,020 | -1,042 | -1,072 | -1,113 | -1,128 | -1,148 | -1,131 | -1,118 |
| 2020's | -859 | -989 | -1,069 | -1,108 |
| - = No Data Reported; -- = Not Applicable; NA = Not Available; W = Withheld to avoid disclosure of individual company data. |
| Release Date: 8/30/2024 |
| Next Release Date: 8/29/2025 |