|
Download Data (XLS File) |
|
||||||||
|
||||||||
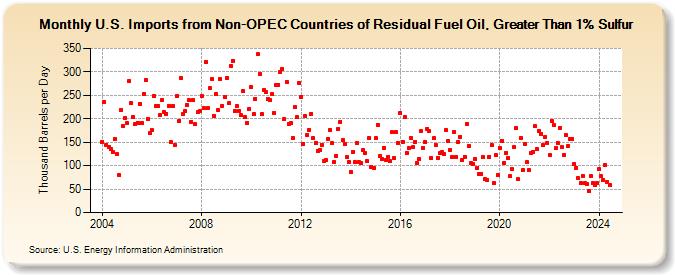
| U.S. Imports from Non-OPEC Countries of Residual Fuel Oil, Greater Than 1% Sulfur (Thousand Barrels per Day) | ||||||||
| Year | Jan | Feb | Mar | Apr | May | Jun | Jul | Aug | Sep | Oct | Nov | Dec |
|---|---|---|---|---|---|---|---|---|---|---|---|---|
| 2004 | 151 | 236 | 145 | 140 | 135 | 129 | 157 | 124 | 80 | 219 | 185 | 202 |
| 2005 | 190 | 280 | 233 | 204 | 189 | 192 | 232 | 191 | 253 | 283 | 200 | 169 |
| 2006 | 175 | 249 | 228 | 227 | 207 | 241 | 214 | 211 | 228 | 150 | 228 | 143 |
| 2007 | 249 | 196 | 286 | 210 | 216 | 230 | 239 | 194 | 239 | 188 | 214 | 216 |
| 2008 | 249 | 223 | 322 | 222 | 265 | 284 | 206 | 253 | 218 | 284 | 228 | 246 |
| 2009 | 287 | 233 | 313 | 324 | 216 | 227 | 217 | 207 | 259 | 203 | 191 | 221 |
| 2010 | 267 | 210 | 243 | 337 | 295 | 210 | 261 | 258 | 243 | 240 | 252 | 213 |
| 2011 | 271 | 273 | 299 | 306 | 199 | 278 | 189 | 190 | 160 | 225 | 203 | 277 |
| 2012 | 246 | 147 | 206 | 166 | 177 | 211 | 158 | 149 | 132 | 133 | 145 | 110 |
| 2013 | 112 | 157 | 176 | 148 | 108 | 121 | 178 | 194 | 154 | 147 | 118 | 108 |
| 2014 | 86 | 130 | 108 | 148 | 107 | 106 | 133 | 126 | 109 | 159 | 98 | 95 |
| 2015 | 158 | 187 | 121 | 115 | 138 | 111 | 119 | 109 | 171 | 116 | 171 | 149 |
| 2016 | 212 | 151 | 204 | 127 | 137 | 159 | 139 | 151 | 106 | 114 | 173 | 138 |
| 2017 | 150 | 179 | 173 | 116 | 158 | 145 | 117 | 126 | 129 | 124 | 175 | 153 |
| 2018 | 134 | 119 | 172 | 119 | 151 | 162 | 112 | 119 | 189 | 142 | 105 | 103 |
| 2019 | 115 | 96 | 83 | 83 | 118 | 72 | 69 | 119 | 144 | 63 | 123 | 80 |
| 2020 | 138 | 153 | 106 | 128 | 117 | 77 | 92 | 139 | 180 | 71 | 159 | 90 |
| 2021 | 146 | 107 | 90 | 128 | 130 | 184 | 135 | 174 | 168 | 143 | 162 | 149 |
| 2022 | 123 | 196 | 187 | 137 | 149 | 181 | 139 | 123 | 165 | 142 | 157 | 157 |
| 2023 | 104 | 96 | 73 | 64 | 79 | 62 | 61 | 46 | 78 | 62 | 59 | 63 |
| 2024 | 92 | 77 | 70 | 101 | 66 | 58 | ||||||
| - = No Data Reported; -- = Not Applicable; NA = Not Available; W = Withheld to avoid disclosure of individual company data. |
| Release Date: 8/30/2024 |
| Next Release Date: 9/30/2024 |