|
Download Data (XLS File) |
|
|||||
|
|||||
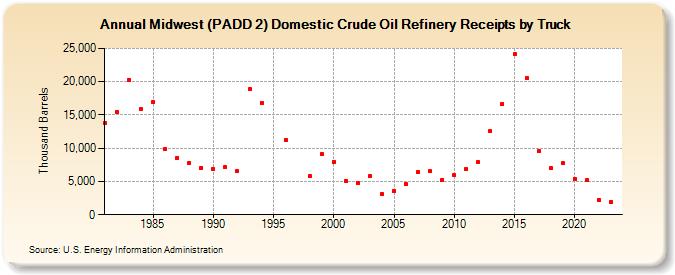
| Midwest (PADD 2) Domestic Crude Oil Refinery Receipts by Truck (Thousand Barrels) | |||||
| Decade | Year-0 | Year-1 | Year-2 | Year-3 | Year-4 | Year-5 | Year-6 | Year-7 | Year-8 | Year-9 |
|---|---|---|---|---|---|---|---|---|---|---|
| 1980's | 13,750 | 15,471 | 20,297 | 15,828 | 16,957 | 9,910 | 8,579 | 7,817 | 7,079 | |
| 1990's | 6,854 | 7,118 | 6,544 | 18,847 | 16,862 | NA | 11,266 | NA | 5,760 | 9,161 |
| 2000's | 7,986 | 5,032 | 4,822 | 5,794 | 3,147 | 3,561 | 4,624 | 6,383 | 6,499 | 5,277 |
| 2010's | 5,915 | 6,846 | 7,856 | 12,540 | 16,701 | 24,145 | 20,528 | 9,564 | 6,953 | 7,713 |
| 2020's | 5,401 | 5,172 | 2,286 | 1,902 |
| - = No Data Reported; -- = Not Applicable; NA = Not Available; W = Withheld to avoid disclosure of individual company data. |
| Release Date: 6/14/2024 |
| Next Release Date: June 2025 |