|
Download Data (XLS File) |
|
|||||
|
|||||
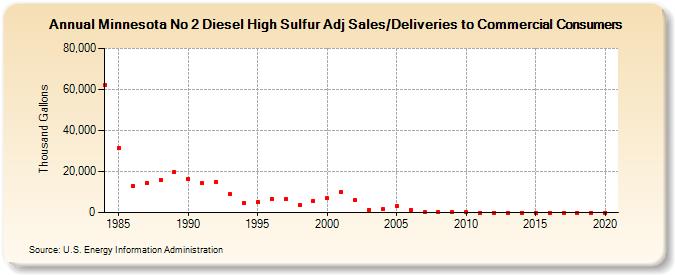
| Minnesota No 2 Diesel High Sulfur Adj Sales/Deliveries to Commercial Consumers (Thousand Gallons) | |||||
| Decade | Year-0 | Year-1 | Year-2 | Year-3 | Year-4 | Year-5 | Year-6 | Year-7 | Year-8 | Year-9 |
|---|---|---|---|---|---|---|---|---|---|---|
| 1980's | 62,038 | 31,432 | 12,926 | 14,429 | 15,899 | 19,683 | ||||
| 1990's | 16,292 | 14,291 | 15,078 | 8,845 | 4,875 | 5,232 | 6,670 | 6,537 | 3,507 | 5,698 |
| 2000's | 6,955 | 9,801 | 5,967 | 1,343 | 1,612 | 2,963 | 1,342 | 313 | 196 | 187 |
| 2010's | 62 | 0 | 0 | 0 | 0 | 0 | 0 | 0 | 0 | 0 |
| 2020's | 0 |
| - = No Data Reported; -- = Not Applicable; NA = Not Available; W = Withheld to avoid disclosure of individual company data. |
| Release Date: 2/9/2022 |
| Next Release Date: Suspended |