|
Download Data (XLS File) |
|
||||||||
|
||||||||
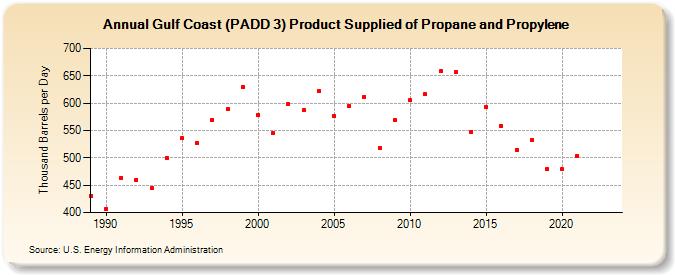
| Gulf Coast (PADD 3) Product Supplied of Propane and Propylene (Thousand Barrels per Day) | ||||||||
| Decade | Year-0 | Year-1 | Year-2 | Year-3 | Year-4 | Year-5 | Year-6 | Year-7 | Year-8 | Year-9 |
|---|---|---|---|---|---|---|---|---|---|---|
| 1980's | 431 | |||||||||
| 1990's | 407 | 464 | 460 | 444 | 500 | 536 | 528 | 570 | 589 | 629 |
| 2000's | 578 | 545 | 598 | 587 | 622 | 577 | 595 | 612 | 518 | 569 |
| 2010's | 605 | 616 | 658 | 656 | 548 | 593 | 558 | 514 | 532 | 479 |
| 2020's | 479 | 503 | -- | -- |
| - = No Data Reported; -- = Not Applicable; NA = Not Available; W = Withheld to avoid disclosure of individual company data. |
| Release Date: 6/28/2024 |
| Next Release Date: 8/30/2024 |