|
Download Data (XLS File) |

|
||||||||
 |
||||||||
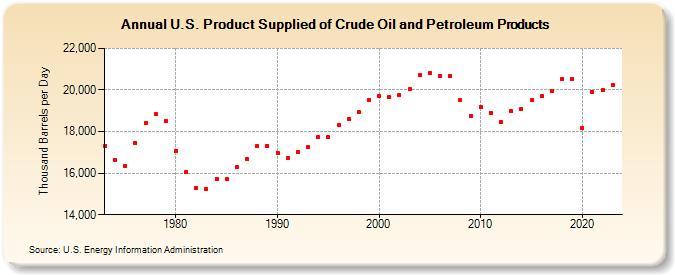
| U.S. Product Supplied of Crude Oil and Petroleum Products (Thousand Barrels per Day) | ||||||||
| Decade | Year-0 | Year-1 | Year-2 | Year-3 | Year-4 | Year-5 | Year-6 | Year-7 | Year-8 | Year-9 |
|---|---|---|---|---|---|---|---|---|---|---|
| 1970's | 17,308 | 16,653 | 16,322 | 17,461 | 18,431 | 18,847 | 18,513 | |||
| 1980's | 17,056 | 16,058 | 15,296 | 15,231 | 15,726 | 15,726 | 16,281 | 16,665 | 17,283 | 17,325 |
| 1990's | 16,988 | 16,714 | 17,033 | 17,237 | 17,718 | 17,725 | 18,309 | 18,620 | 18,917 | 19,519 |
| 2000's | 19,701 | 19,649 | 19,761 | 20,034 | 20,731 | 20,802 | 20,687 | 20,680 | 19,498 | 18,771 |
| 2010's | 19,178 | 18,896 | 18,482 | 18,967 | 19,100 | 19,532 | 19,692 | 19,952 | 20,512 | 20,543 |
| 2020's | 18,186 | 19,890 | 20,010 | 20,275 |
| - = No Data Reported; -- = Not Applicable; NA = Not Available; W = Withheld to avoid disclosure of individual company data. |
| Release Date: 11/29/2024 |
| Next Release Date: 8/29/2025 |