|
Download Data (XLS File) |
|
||||||||
|
||||||||
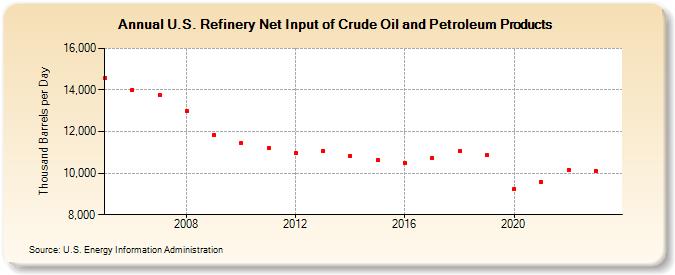
| U.S. Refinery Net Input of Crude Oil and Petroleum Products (Thousand Barrels per Day) | ||||||||
| Decade | Year-0 | Year-1 | Year-2 | Year-3 | Year-4 | Year-5 | Year-6 | Year-7 | Year-8 | Year-9 |
|---|---|---|---|---|---|---|---|---|---|---|
| 2000's | 14,590 | 14,002 | 13,754 | 12,994 | 11,835 | |||||
| 2010's | 11,448 | 11,210 | 10,949 | 11,061 | 10,835 | 10,634 | 10,506 | 10,731 | 11,068 | 10,853 |
| 2020's | 9,240 | 9,585 | 10,153 | 10,118 |
| - = No Data Reported; -- = Not Applicable; NA = Not Available; W = Withheld to avoid disclosure of individual company data. |
| Release Date: 7/31/2024 |
| Next Release Date: 8/30/2024 |