|
Download Data (XLS File) |
|
||||||||
|
||||||||
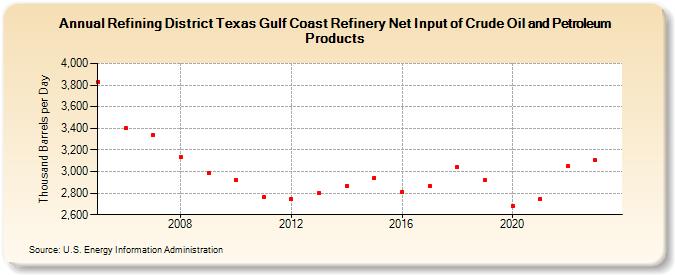
| Refining District Texas Gulf Coast Refinery Net Input of Crude Oil and Petroleum Products (Thousand Barrels per Day) | ||||||||
| Decade | Year-0 | Year-1 | Year-2 | Year-3 | Year-4 | Year-5 | Year-6 | Year-7 | Year-8 | Year-9 |
|---|---|---|---|---|---|---|---|---|---|---|
| 2000's | 3,831 | 3,400 | 3,336 | 3,130 | 2,984 | |||||
| 2010's | 2,922 | 2,767 | 2,745 | 2,801 | 2,866 | 2,944 | 2,808 | 2,870 | 3,040 | 2,917 |
| 2020's | 2,682 | 2,747 | 3,047 | 3,104 |
| - = No Data Reported; -- = Not Applicable; NA = Not Available; W = Withheld to avoid disclosure of individual company data. |
| Release Date: 6/28/2024 |
| Next Release Date: 8/30/2024 |