|
Download Data (XLS File) |
|
||||||||
|
||||||||
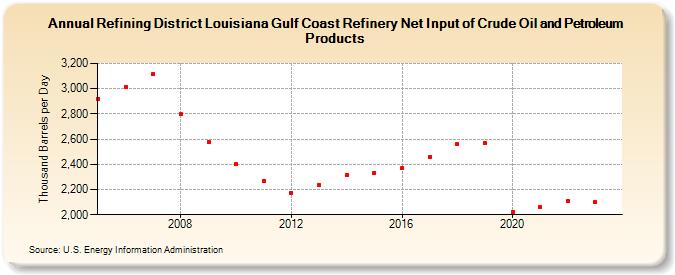
| Refining District Louisiana Gulf Coast Refinery Net Input of Crude Oil and Petroleum Products (Thousand Barrels per Day) | ||||||||
| Decade | Year-0 | Year-1 | Year-2 | Year-3 | Year-4 | Year-5 | Year-6 | Year-7 | Year-8 | Year-9 |
|---|---|---|---|---|---|---|---|---|---|---|
| 2000's | 2,920 | 3,017 | 3,115 | 2,797 | 2,575 | |||||
| 2010's | 2,401 | 2,269 | 2,175 | 2,236 | 2,315 | 2,332 | 2,367 | 2,461 | 2,559 | 2,568 |
| 2020's | 2,020 | 2,060 | 2,109 | 2,099 |
| - = No Data Reported; -- = Not Applicable; NA = Not Available; W = Withheld to avoid disclosure of individual company data. |
| Release Date: 6/28/2024 |
| Next Release Date: 8/30/2024 |