|
Download Data (XLS File) |
|
||||||||
|
||||||||
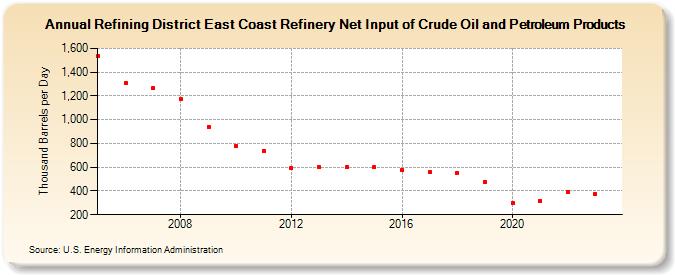
| Refining District East Coast Refinery Net Input of Crude Oil and Petroleum Products (Thousand Barrels per Day) | ||||||||
| Decade | Year-0 | Year-1 | Year-2 | Year-3 | Year-4 | Year-5 | Year-6 | Year-7 | Year-8 | Year-9 |
|---|---|---|---|---|---|---|---|---|---|---|
| 2000's | 1,532 | 1,309 | 1,266 | 1,170 | 941 | |||||
| 2010's | 782 | 738 | 590 | 600 | 598 | 598 | 578 | 558 | 551 | 474 |
| 2020's | 298 | 318 | 391 | 373 |
| - = No Data Reported; -- = Not Applicable; NA = Not Available; W = Withheld to avoid disclosure of individual company data. |
| Release Date: 7/31/2024 |
| Next Release Date: 8/30/2024 |