|
Download Data (XLS File) |
|
||||||||
|
||||||||
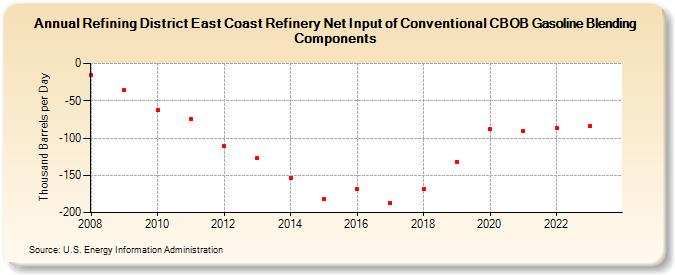
| Refining District East Coast Refinery Net Input of Conventional CBOB Gasoline Blending Components (Thousand Barrels per Day) | ||||||||
| Decade | Year-0 | Year-1 | Year-2 | Year-3 | Year-4 | Year-5 | Year-6 | Year-7 | Year-8 | Year-9 |
|---|---|---|---|---|---|---|---|---|---|---|
| 2000's | -16 | -36 | ||||||||
| 2010's | -63 | -74 | -111 | -127 | -153 | -182 | -168 | -187 | -169 | -132 |
| 2020's | -88 | -91 | -87 | -84 |
| - = No Data Reported; -- = Not Applicable; NA = Not Available; W = Withheld to avoid disclosure of individual company data. |
| Release Date: 7/31/2024 |
| Next Release Date: 8/30/2024 |