|
Download Data (XLS File) |
|
||||||||
|
||||||||
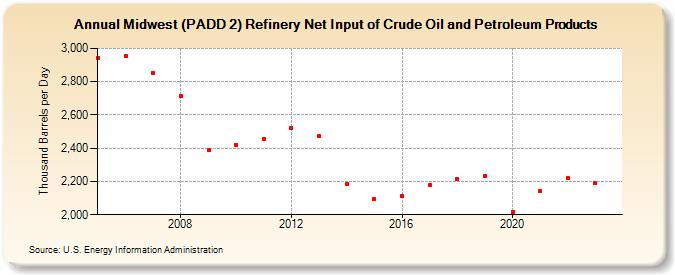
| Midwest (PADD 2) Refinery Net Input of Crude Oil and Petroleum Products (Thousand Barrels per Day) | ||||||||
| Decade | Year-0 | Year-1 | Year-2 | Year-3 | Year-4 | Year-5 | Year-6 | Year-7 | Year-8 | Year-9 |
|---|---|---|---|---|---|---|---|---|---|---|
| 2000's | 2,944 | 2,954 | 2,850 | 2,712 | 2,392 | |||||
| 2010's | 2,422 | 2,455 | 2,523 | 2,471 | 2,185 | 2,095 | 2,114 | 2,178 | 2,212 | 2,235 |
| 2020's | 2,015 | 2,140 | 2,221 | 2,188 |
| - = No Data Reported; -- = Not Applicable; NA = Not Available; W = Withheld to avoid disclosure of individual company data. |
| Release Date: 6/28/2024 |
| Next Release Date: 8/30/2024 |