|
Download Data (XLS File) |
|
||||||||
|
||||||||
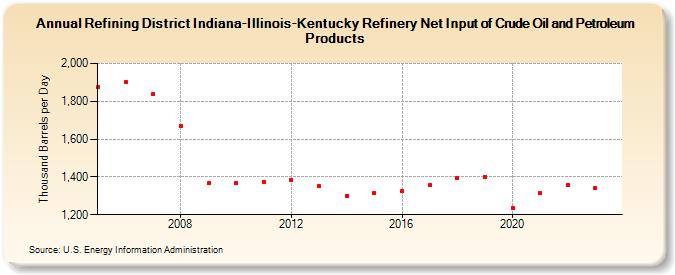
| Refining District Indiana-Illinois-Kentucky Refinery Net Input of Crude Oil and Petroleum Products (Thousand Barrels per Day) | ||||||||
| Decade | Year-0 | Year-1 | Year-2 | Year-3 | Year-4 | Year-5 | Year-6 | Year-7 | Year-8 | Year-9 |
|---|---|---|---|---|---|---|---|---|---|---|
| 2000's | 1,878 | 1,901 | 1,841 | 1,671 | 1,366 | |||||
| 2010's | 1,369 | 1,375 | 1,384 | 1,350 | 1,299 | 1,315 | 1,325 | 1,356 | 1,392 | 1,401 |
| 2020's | 1,237 | 1,315 | 1,357 | 1,342 |
| - = No Data Reported; -- = Not Applicable; NA = Not Available; W = Withheld to avoid disclosure of individual company data. |
| Release Date: 7/31/2024 |
| Next Release Date: 8/30/2024 |