|
Download Data (XLS File) |

|
||||||||
 |
||||||||
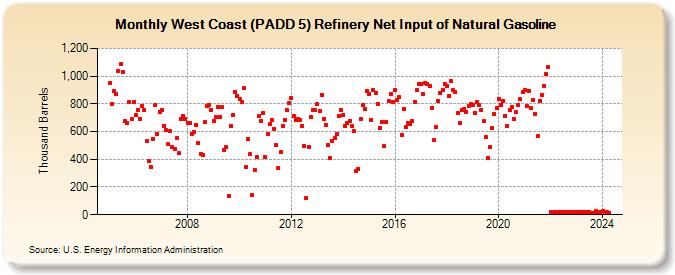
| West Coast (PADD 5) Refinery Net Input of Natural Gasoline (Thousand Barrels) | ||||||||
| Year | Jan | Feb | Mar | Apr | May | Jun | Jul | Aug | Sep | Oct | Nov | Dec |
|---|---|---|---|---|---|---|---|---|---|---|---|---|
| 2005 | 951 | 799 | 889 | 873 | 1,040 | 1,086 | 1,028 | 674 | 665 | 814 | 692 | 815 |
| 2006 | 717 | 755 | 693 | 787 | 754 | 530 | 386 | 343 | 547 | 793 | 580 | 743 |
| 2007 | 757 | 641 | 611 | 510 | 601 | 487 | 475 | 553 | 445 | 689 | 712 | 687 |
| 2008 | 662 | 663 | 585 | 597 | 646 | 515 | 440 | 434 | 666 | 784 | 793 | 759 |
| 2009 | 674 | 707 | 778 | 708 | 778 | 468 | 485 | 132 | 642 | 719 | 884 | 853 |
| 2010 | 838 | 810 | 912 | 345 | 546 | 438 | 140 | 323 | 415 | 711 | 677 | 736 |
| 2011 | 413 | 580 | 652 | 680 | 622 | 500 | 336 | 449 | 643 | 681 | 754 | 803 |
| 2012 | 842 | 713 | 686 | 688 | 681 | 639 | 499 | 119 | 487 | 704 | 755 | 752 |
| 2013 | 796 | 745 | 865 | 694 | 649 | 503 | 406 | 529 | 553 | 579 | 709 | 759 |
| 2014 | 718 | 639 | 663 | 679 | 637 | 602 | 319 | 329 | 694 | 794 | 762 | 895 |
| 2015 | 868 | 685 | 898 | 879 | 797 | 628 | 670 | 495 | 669 | 821 | 873 | 810 |
| 2016 | 898 | 830 | 849 | 577 | 764 | 632 | 663 | 655 | 674 | 815 | 899 | 945 |
| 2017 | 940 | 869 | 953 | 941 | 931 | 770 | 536 | 630 | 820 | 881 | 902 | 944 |
| 2018 | 926 | 857 | 965 | 899 | 884 | 731 | 662 | 759 | 765 | 740 | 787 | 801 |
| 2019 | 792 | 733 | 814 | 789 | 756 | 677 | 558 | 406 | 489 | 624 | 727 | 768 |
| 2020 | 834 | 790 | 817 | 714 | 639 | 756 | 780 | 694 | 738 | 790 | 832 | 883 |
| 2021 | 899 | 781 | 891 | 768 | 829 | 728 | 566 | 823 | 867 | 931 | 1,016 | 1,063 |
| 2022 | 17 | 15 | 20 | 15 | 17 | 19 | 19 | 21 | 20 | 23 | 17 | 21 |
| 2023 | 20 | 17 | 19 | 17 | 21 | 21 | 19 | 14 | 9 | 24 | 17 | 17 |
| 2024 | 24 | 18 | 22 | 15 | 20 | 24 | 19 | |||||
| - = No Data Reported; -- = Not Applicable; NA = Not Available; W = Withheld to avoid disclosure of individual company data. |
| Release Date: 9/30/2024 |
| Next Release Date: 10/31/2024 |
Referring Pages: