Today in Energy
Recent Today in Energy analysis of natural gas markets is available on the EIA website.
Market Highlights:
(For the week ending Wednesday, September 25, 2024)Prices
- Henry Hub spot price: The Henry Hub spot price rose 29 cents from $2.33 per million British thermal units (MMBtu) last Wednesday to $2.62/MMBtu yesterday.
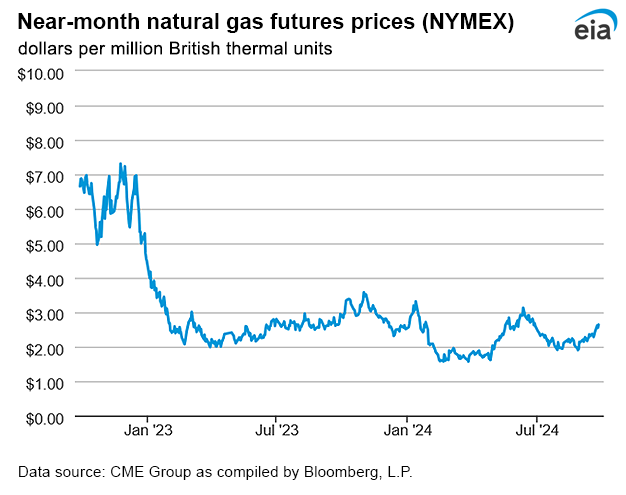
- Henry Hub futures price: The price of the October 2024 NYMEX contract increased 35.3 cents, from $2.284/MMBtu last Wednesday to $2.637/MMBtu yesterday. The price of the 12-month strip averaging October 2024 through September 2025 futures contracts climbed 19.1 cents to $3.134/MMBtu.
- Select regional spot prices: Natural gas spot prices rose at most locations this report week (Wednesday, September 18 to Wednesday, September 25). Price changes ranged from a decrease of 59 cents at the Waha Hub to an increase of 54 cents at the FGT Citygate in Florida.
- Prices in the Northeast fell this report week. The price at the Algonquin Citygate, which serves Boston-area consumers, fell 3 cents from $2.00/MMBtu last week to $1.97/MMBtu yesterday. At the Transco Zone 6 NY trading point for New York City, the price fell 14 cents from $1.76/MMBtu last Wednesday to $1.62/MMBtu yesterday. Temperatures in the New York-Central Park Area averaged 69°F, resulting in 29 cooling degree days (CDDs), 18 fewer CDDs than last week. Consumption of natural gas in the electric power sector fell 12% (0.3 billion cubic feet per day [Bcf/d]) in New York and New Jersey and fell 10% (0.1 Bcf/d) in New England, according to data from S&P Global Commodity Insights.
- Prices in the Southeast increased this report week. The price at the FGT Citygate, which delivers natural gas in Florida, rose 54 cents from $2.88/MMBtu last Wednesday to $3.42/MMBtu yesterday. Although natural gas production in the Gulf of Mexico rose by 42% (0.5 Bcf/d) this report week, according to data from S&P Global Commodity Insights, offshore oil and gas operators temporarily shut in production as a precaution as Hurricane Helene neared the Gulf Coast, taking 17% (0.3 Bcf/d) of natural gas production capacity offline as of Wednesday, September 25. Temperatures in the Tampa Area averaged 84°F, leading to 137 CDDs, 6 CDDs more than last week and 16 more than normal. Consumption of natural gas in the electric power sector rose 7% (0.8 Bcf/d) across the Southeast region, led by a 6% (0.4 Bcf/d) increase in consumption in the Atlantic Coast sub-region, according to data from S&P Global Commodity Insights.
- Prices on the West Coast increased this report week. The price at PG&E Citygate in Northern California rose 45 cents from $2.53/MMBtu yesterday to $2.98/MMBtu yesterday. The price at SoCal Citygate in Southern California increased 50 cents from $1.93/MMBtu last Wednesday to $2.43/MMBtu yesterday. Temperatures in the Riverside Area, east of Los Angeles, averaged 72°F this report week, compared with 70°F last week, resulting in 52 CDDs, 16 CDDs more than last week. Temperatures in the Sacramento Area followed a similar trend, averaging 74°F this week, resulting in 63 CDDs, 30 more CDDs than last week. Natural gas consumption in the electric power sector in California rose 42% (0.5 Bcf/d) this report week, according to data from S&P Global Commodity Insights.
- International futures prices: International natural gas futures price changes were mixed this report week. According to Bloomberg Finance, L.P., weekly average front-month futures prices for liquefied natural gas (LNG) cargoes in East Asia decreased 37 cents to a weekly average of $13.03/MMBtu. Natural gas futures for delivery at the Title Transfer Facility (TTF) in the Netherlands increased 10 cents to a weekly average of $11.54/MMBtu. In the same week last year (week ending September 27, 2023), the prices were $14.63/MMBtu in East Asia and $12.61/MMBtu at TTF.
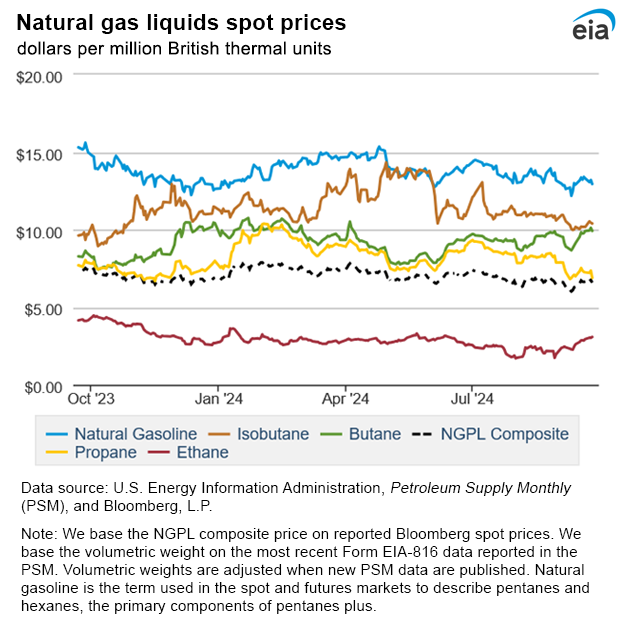
- Natural gas plant liquids (NGPL) prices: The natural gas plant liquids composite price at Mont Belvieu, Texas, rose by 16 cents/MMBtu, averaging $6.66/MMBtu for the week ending September 25. Ethane prices rose 10% week over week, while weekly average natural gas prices at the Houston Ship Channel increased 7%, widening the ethane premium to natural gas by 20%. The ethylene spot price fell 8% week over week, and the ethylene premium to ethane decreased 12%. Propane prices decreased 1%, while Brent crude oil prices increased 2% week over week, widening the propane discount to crude oil by 7%. Normal butane prices rose 5%, isobutane prices rose 2%, and natural gasoline prices were essentially unchanged.
Daily spot prices by region are available on the EIA website.
Supply and Demand
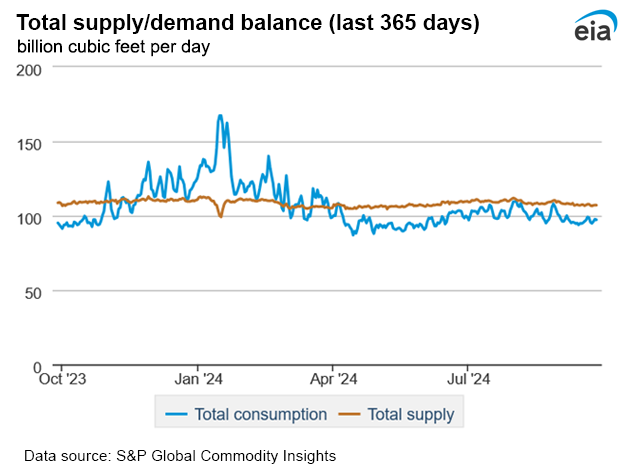
- Supply: According to data from S&P Global Commodity Insights, the average total supply of natural gas was essentially unchanged from the previous report week, averaging 107.2 Bcf/d. Dry natural gas production remained unchanged at 101.2 Bcf/d and average net imports from Canada decreased by 0.4% (less than 0.1 Bcf/d) from last week.
- Demand: Total U.S. consumption of natural gas rose by 2.5% (1.7 Bcf/d) compared with the previous report week, according to data from S&P Global Commodity Insights. Natural gas consumed for power generation increased by 4.3% (1.7 Bcf/d) week over week. Consumption in the industrial sector decreased by 0.2% (less than 0.1 Bcf/d), and residential and commercial sector consumption increased by 1.5% (0.1 Bcf/d). Natural gas exports to Mexico increased 4.3% (0.3 Bcf/d). Natural gas deliveries to U.S. LNG export facilities (LNG pipeline receipts) averaged 12.6 Bcf/d, or 0.3 Bcf/d lower than last report week.
Liquefied Natural Gas (LNG)
- Pipeline receipts: Average natural gas deliveries to U.S. LNG export terminals decreased 0.3 Bcf/d from last week to 12.6 Bcf/d, according to data from S&P Global Commodity Insights. Natural gas deliveries to terminals in South Louisiana increased by 1.2% (0.1 Bcf/d) to 7.8 Bcf/d, and natural gas deliveries to terminals in South Texas increased by 6.5% (0.3 Bcf/d) to 4.4 Bcf/d. Natural gas deliveries to terminals outside the Gulf Coast decreased by 56.5% (0.6 Bcf/d) to 0.5 Bcf/d.
- Vessels departing U.S. ports: Twenty-two LNG vessels (eight from Sabine Pass; four each from Cameron, Corpus Christi, and Freeport; and two from Calcasieu Pass) with a combined LNG-carrying capacity of 83 Bcf departed the United States between September 19 and September 25, according to shipping data provided by Bloomberg Finance, L.P.
- LNG Terminals: The Cove Point LNG export terminal in Lusby, Maryland, shut down operations around September 20 for planned annual maintenance that is scheduled to last about three weeks.
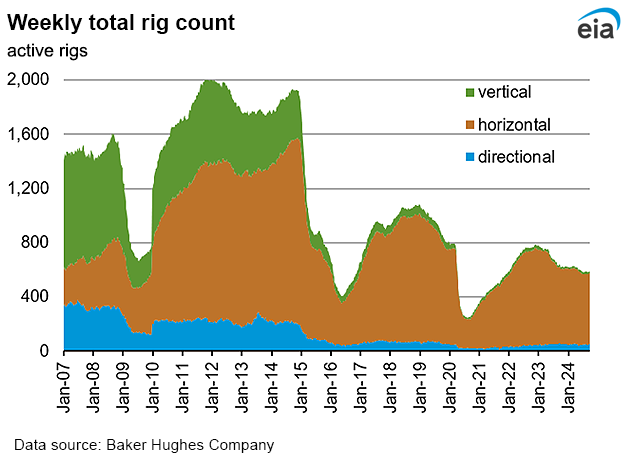
Rig Count
- According to Baker Hughes, for the week ending Tuesday, September 17, the natural gas rig count decreased by 1 rig from a week ago to 96 rigs as 1 rig was dropped among unidentified producing regions. The number of oil-directed rigs was unchanged from a week ago at 488 rigs. The DJ-Niobrara dropped one rig, and the Permian added one rig. The total rig count, which includes 4 miscellaneous rigs, now stands at 588 rigs, 42 fewer rigs than a year ago.
Storage
- Working gas stocks increased 47 Bcf for the week ending September 20, compared with the five-year (2019–2023) average net injections of 88 Bcf and last year's net injections of 82 Bcf during the same week. Working natural gas stocks totaled 3,492 Bcf, which is 233 Bcf (7%) more than the five-year average and 159 Bcf (5%) more than last year at this time.
- This week’s report included a reclassification totaling 8 Bcf from working natural gas storage to base gas. Reclassifications are non-flow adjustments to working gas levels based on an accounting or engineering assessment of the facility’s operational capabilities. This week’s reclassification reduced working gas stocks by 8 Bcf for the week ending September 20. The implied flows — excluding the effect of the reclassification — into working gas storage totaled 55 Bcf during the report week.
- According to The Desk survey of natural gas analysts, estimates of the weekly net change to working natural gas stocks ranged from net injections of 45 Bcf to 59 Bcf, with a median estimate of 54 Bcf.
- The average rate of injections into storage is 25% lower than the five-year average so far in the refill season (April through October). If the rate of injections into storage matched the five-year average of 11.1 Bcf/d for the remainder of the refill season, the total inventory would be 3,945 Bcf on October 31, which is 233 Bcf higher than the five-year average of 3,712 Bcf for that time of year.
See also:
Top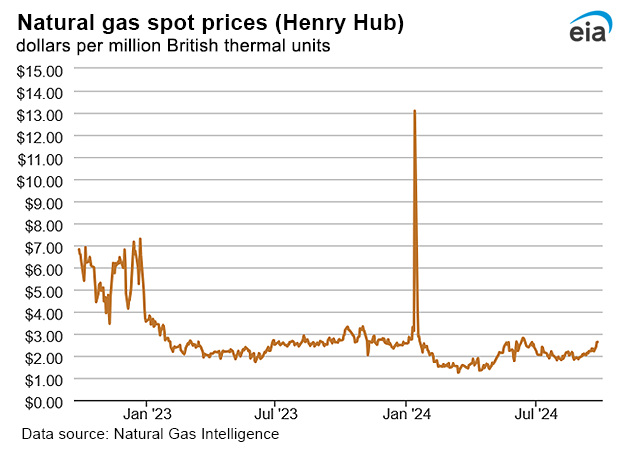
| Spot Prices ($/MMBtu) | Thu, 19-Sep |
Fri, 20-Sep |
Mon, 23-Sep |
Tue, 24-Sep |
Wed, 25-Sep |
|---|---|---|---|---|---|
| Henry Hub |
2.22 |
2.21 |
2.41 |
2.62 |
2.62 |
| New York |
1.50 |
1.30 |
1.63 |
1.48 |
1.62 |
| Chicago |
1.90 |
1.94 |
2.22 |
2.40 |
2.29 |
| Cal. Comp. Avg.* |
1.80 |
1.94 |
2.44 |
2.51 |
2.50 |
| *Avg. of NGI's reported prices for: Malin, PG&E Citygate, and Southern California Border Avg. | |||||
| Data Source: NGI's Daily Gas Price Index | |||||
| U.S. natural gas supply - Gas Week: (9/19/24 - 9/25/24) | |||
|---|---|---|---|
Average daily values (billion cubic feet) |
|||
this week |
last week |
last year |
|
| Marketed production | 114.8 |
114.7 |
116.4 |
| Dry production | 101.2 |
101.2 |
103.2 |
| Net Canada imports | 5.9 |
5.9 |
4.5 |
| LNG pipeline deliveries | 0.1 |
0.1 |
0.1 |
| Total supply | 107.2 |
107.2 |
107.8 |
|
Data source: S&P Global Commodity Insights | |||
| U.S. natural gas consumption - Gas Week: (9/19/24 - 9/25/24) | |||
|---|---|---|---|
Average daily values (billion cubic feet) |
|||
this week |
last week |
last year |
|
| U.S. consumption | 71.0 |
69.2 |
68.0 |
| Power | 40.3 |
38.7 |
37.0 |
| Industrial | 21.8 |
21.8 |
22.0 |
| Residential/commercial | 8.9 |
8.7 |
9.0 |
| Mexico exports | 7.0 |
6.7 |
6.7 |
| Pipeline fuel use/losses | 6.6 |
6.6 |
6.7 |
| LNG pipeline receipts | 12.6 |
12.9 |
12.2 |
| Total demand | 97.2 |
95.4 |
93.6 |
|
Data source: S&P Global Commodity Insights | |||
| Rigs | |||
|---|---|---|---|
Tue, September 17, 2024 |
Change from |
||
|
last week
|
last year
|
||
| Oil rigs |
488
|
0.0%
|
-3.7%
|
| Natural gas rigs |
96
|
-1.0%
|
-18.6%
|
| Note: Excludes any miscellaneous rigs | |||
| Rig numbers by type | |||
|---|---|---|---|
Tue, September 17, 2024 |
Change from |
||
|
last week
|
last year
|
||
| Vertical |
15
|
0.0%
|
-6.3%
|
| Horizontal |
523
|
0.0%
|
-6.3%
|
| Directional |
50
|
-3.8%
|
-10.7%
|
| Data source: Baker Hughes Company | |||
| Working gas in underground storage | ||||
|---|---|---|---|---|
Stocks billion cubic feet (Bcf) |
||||
| Region |
2024-09-20 |
2024-09-13 |
change |
|
| East |
818 |
802 |
16 |
|
| Midwest |
993 |
973 |
20 |
|
| Mountain |
279 |
275 |
4 |
|
| Pacific |
289 |
283 |
6 |
|
| South Central |
1,113 C |
1,111 |
2 |
|
| Total |
3,492 C |
3,445 |
47 |
|
|
Data source: U.S. Energy Information Administration Form EIA-912, Weekly Underground Natural Gas Storage Report Note: Totals may not equal sum of components because of independent rounding. Note: Reclassifications from working gas to base gas decreased working gas stocks 8 Bcf in the salt South Central region for the week ending September 20, 2024. The implied flow for the week is an increase of 55 Bcf to working gas stocks. (See Notes and Definitions for more information on "implied flow.") C=Reclassification. | ||||
| Working gas in underground storage | |||||
|---|---|---|---|---|---|
Historical comparisons |
|||||
Year ago 9/20/23 |
5-year average 2019-2023 |
||||
| Region | Stocks (Bcf) |
% change |
Stocks (Bcf) |
% change |
|
| East |
813 |
0.6 |
787 |
3.9 |
|
| Midwest |
953 |
4.2 |
937 |
6.0 |
|
| Mountain |
232 |
20.3 |
205 |
36.1 |
|
| Pacific |
269 |
7.4 |
270 |
7.0 |
|
| South Central | 1,066 |
4.4 |
1,060 |
5.0 |
|
| Total | 3,333 |
4.8 |
3,259 |
7.1 |
|
| Data source: U.S. Energy Information Administration Form EIA-912, Weekly Underground Natural Gas Storage Report
Note: Totals may not equal sum of components because of independent rounding. |
|||||
| Temperature – heating & cooling degree days (week ending Sep 19) | ||||||||
|---|---|---|---|---|---|---|---|---|
HDDs |
CDDs |
|||||||
| Region | Current total |
Deviation from normal |
Deviation from last year |
Current total |
Deviation from normal |
Deviation from last year |
||
| New England | 7 |
-24 |
-14 |
9 |
6 |
7 |
||
| Middle Atlantic | 4 |
-19 |
-17 |
14 |
2 |
13 |
||
| E N Central | 4 |
-23 |
-32 |
39 |
26 |
38 |
||
| W N Central | 1 |
-30 |
-21 |
58 |
40 |
42 |
||
| South Atlantic | 1 |
-5 |
-5 |
64 |
4 |
9 |
||
| E S Central | 1 |
-6 |
-6 |
60 |
12 |
19 |
||
| W S Central | 0 |
-2 |
0 |
102 |
22 |
17 |
||
| Mountain | 23 |
-13 |
-2 |
31 |
-7 |
-3 |
||
| Pacific | 20 |
8 |
15 |
5 |
25 |
-9 |
||
| United States | 7 |
-12 |
-11 |
43 |
8 |
14 |
||
|
Data source: National Oceanic and Atmospheric Administration Note: HDDs=heating degree days; CDDs=cooling degree days | ||||||||
Average temperature (°F)
7-day mean ending Sep 19, 2024
Data source: National Oceanic and Atmospheric Administration
Deviation between average and normal temperature (°F)
7-day mean ending Sep 19, 2024
Data source: National Oceanic and Atmospheric Administration
Monthly U.S. dry shale natural gas production by formation is available in the Short-Term Energy Outlook.