Today in Energy
Recent Today in Energy analysis of natural gas markets is available on the EIA website.
Market Highlights:
(For the week ending Wednesday, August 28, 2024)Prices
- Henry Hub spot price: The Henry Hub spot price fell 23 cents from $2.12 per million British thermal units (MMBtu) last Wednesday to $1.89/MMBtu yesterday.
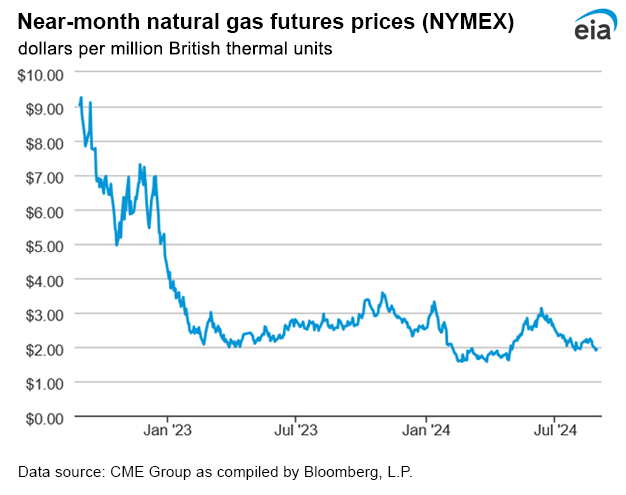
- Henry Hub futures price: The September 2024 NYMEX contract expired yesterday at $1.930/MMBtu, down 25 cents from last Wednesday. The October 2024 NYMEX contract price decreased to $2.097/MMBtu, down 22 cents from last Wednesday to yesterday. The price of the 12-month strip averaging October 2024 through September 2025 futures contracts declined 11 cents to $2.957/MMBtu.
- Select regional spot prices: Natural gas spot prices fell at all major pricing locations this report week (Wednesday, August 21, to Wednesday, August 28). Price declines ranged from $2.83 at the Waha Hub in West Texas to 1 cent at Eastern Gas South.
- Prices in the Northeast decreased this report week despite rising temperatures and increased natural gas consumption toward the end of the report week. At the Algonquin Citygate, which serves Boston-area consumers, the price fell 9 cents from $1.57/MMBtu last Wednesday to $1.48/MMBtu yesterday. At the Transcontinental Pipeline Zone 6 trading point for New York City, the price decreased 2 cents from $1.45/MMBtu last Wednesday to $1.43/MMBtu yesterday. The average temperature in the New York-Central Park Area was 75°F this week, 2°F higher than last week, but rose to an average of 83°F yesterday, 8°F above normal. This resulted in 72 cooling degree days (CDD) this week, 15 CDDs more than last week and 1 CDD above normal.
- Prices in the Southeast fell this report week. The price at the FGT Citygate, which delivers natural gas into Florida, fell from $2.52/MMBtu last Wednesday to $2.49/MMBtu yesterday, which was the highest price among major pricing hubs this report week. Average temperatures in the Orlando Area fell 1°F from last report week, resulting in 129 CDDs, 4 fewer CDDs than the previous week and 7 CDDs above normal. Natural gas consumption in the electric power sector across the Southeast fell 3.5% (0.4 billion cubic feet per day [Bcf/d]) this week, according to data from S&P Global Commodity Insights.
- Prices on the West Coast fell this report week. The price at Northwest Sumas on the Canada-Washington border, the main pricing point for natural gas in the Pacific Northwest, fell 15 cents from $1.43/MMBtu last Wednesday to $1.28/MMBtu yesterday. The price at PG&E Citygate in Northern California fell 14 cents from $2.40/MMBtu last Wednesday to $2.26/MMBtu yesterday. The PG&E Citygate price yesterday was the second-highest price among major pricing hubs this report week. The price at SoCal Citygate in Southern California decreased 16 cents from $1.67/MMBtu last Wednesday to $1.51/MMBtu yesterday. In the Riverside Area, east of Los Angeles, average temperatures fell 6°F from the previous report week to 76°F, or 3°F below normal, leading to 81 CDDs, down 36 CDDs from the previous report week. Consumption of natural gas in the electric power sector fell 12.9% (0.7 Bcf/d) in the Western region this report week, led by a 14.8% (0.4 Bcf/d) decrease in the Desert Southwest and a 12.0% (0.2 Bcf/d) decrease in California, according to data from S&P Global Commodity Insights.
- Prices in West Texas fell this report week. The price at the Waha Hub, located near Permian Basin production activities, fell $2.83 from -$0.85/MMBtu last Wednesday to -$3.67/MMBtu yesterday. The price at Waha was last above zero on July 25, when the price was 33 cents/MMBtu. Natural gas processing and pipeline takeaway capacity constraints have kept Waha prices below zero for much of the year. Relatively high natural gas production in the Permian Basin and pipeline maintenance have resulted in negative prices at the Waha Hub on 45% of trading days in 2024. The Waha Hub traded $5.56 below the Henry Hub price yesterday, compared with last Wednesday when it traded $2.97 below the Henry Hub price.
- International futures prices: International natural gas futures price changes were mixed this report week. According to Bloomberg Finance, L.P., weekly average front-month futures prices for liquefied natural gas (LNG) cargoes in East Asia were unchanged this week at $13.90/MMBtu. Natural gas futures for delivery at the Title Transfer Facility (TTF) in the Netherlands decreased 28 cents to a weekly average of $12.32/MMBtu. In the same week last year (week ending August 30, 2023), the prices were $13.33/MMBtu in East Asia and $11.22/MMBtu at TTF.
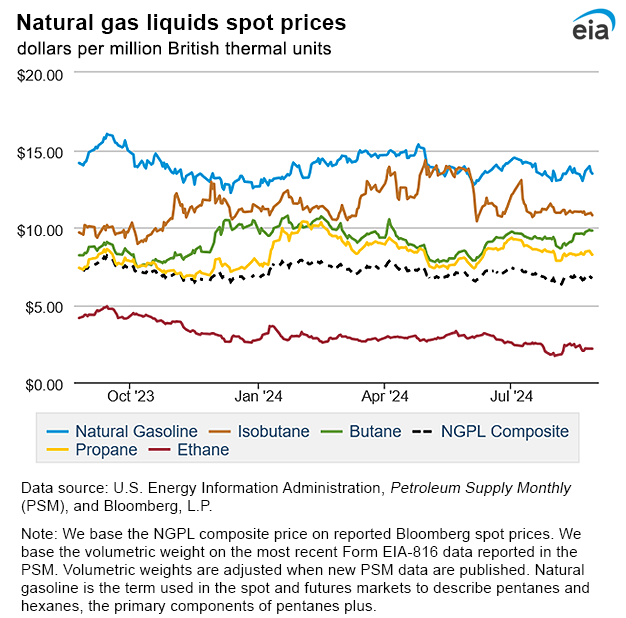
- Natural gas plant liquids (NGPL) prices: The natural gas plant liquids composite price at Mont Belvieu, Texas, rose by 1 cent/MMBtu, averaging $6.75/MMBtu for the week ending August 28. Ethane prices fell 5% week over week, while weekly average natural gas prices at the Houston Ship Channel decreased 9%, widening the ethane premium to natural gas by 13%. The ethylene spot price fell 3% week over week, and the ethylene premium to ethane decreased 2%. Propane prices increased 1% and Brent crude oil prices increased 1% week over week, widening the propane discount to crude oil by 1% for the week. Normal butane prices rose 2%, isobutane prices fell 1%, and natural gasoline prices rose 1%.
Daily spot prices by region are available on the EIA website.
Supply and Demand
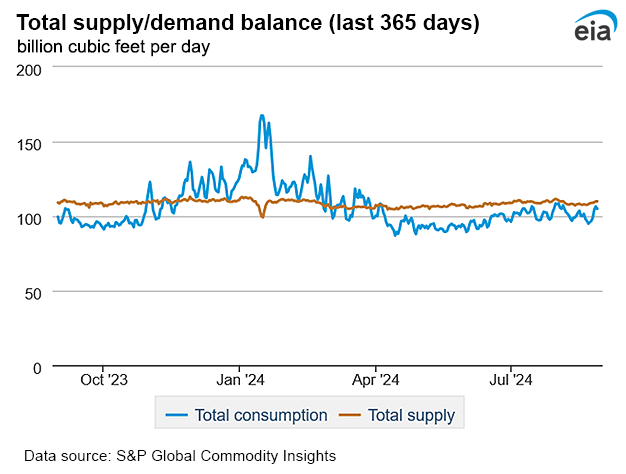
- Supply: According to data from S&P Global Commodity Insights, the average total supply of natural gas rose by 1.1% (1.2 Bcf/d) compared with the previous report week. Dry natural gas production grew by 0.7% (0.7 Bcf/d), averaging 102.0 Bcf/d, and average net imports from Canada increased by 7.9% (0.5 Bcf/d) from last week.
- Demand: Total U.S. consumption of natural gas rose by 0.3% (0.2 Bcf/d) compared with the previous report week, according to data from S&P Global Commodity Insights. Natural gas consumed for power generation declined by 0.2% (0.1 Bcf/d) week over week. Consumption in the industrial sector remained unchanged, averaging 21.7 Bcf/d and consumption in the residential and commercial sector increased by 4.0% (0.3 Bcf/d). Natural gas exports to Mexico decreased 1.3% (0.1 Bcf/d). Natural gas deliveries to U.S. LNG export facilities (LNG pipeline receipts) averaged 12.7 Bcf/d, or 0.2 Bcf/d lower than last week.
Liquefied Natural Gas (LNG)
- Pipeline receipts: Average natural gas deliveries to U.S. LNG export terminals decreased 0.2 Bcf/d from last week to 12.7 Bcf/d, according to data from S&P Global Commodity Insights. Natural gas deliveries to terminals in South Louisiana increased by 1.9% (0.2 Bcf/d) to 7.7 Bcf/d, while natural gas deliveries to terminals in South Texas decreased 8.9% (0.4 Bcf/d) to 4.0 Bcf/d. Natural gas deliveries on Gulf South Pipeline to Freeport LNG fell to nearly zero yesterday from 1.4 Bcf/d Tuesday. Natural gas deliveries to terminals outside the Gulf Coast were essentially unchanged at 1.0 Bcf/d.
- Vessels departing U.S. ports: Twenty-six LNG vessels (eight from Sabine Pass, five from Cameron, four each from Corpus Christi and Freeport, two each from Calcasieu Pass and Elba Island, and one from Cove Point) with a combined LNG-carrying capacity of 98 Bcf departed the United States between August 22 and August 28, according to shipping data provided by Bloomberg Finance, L.P.
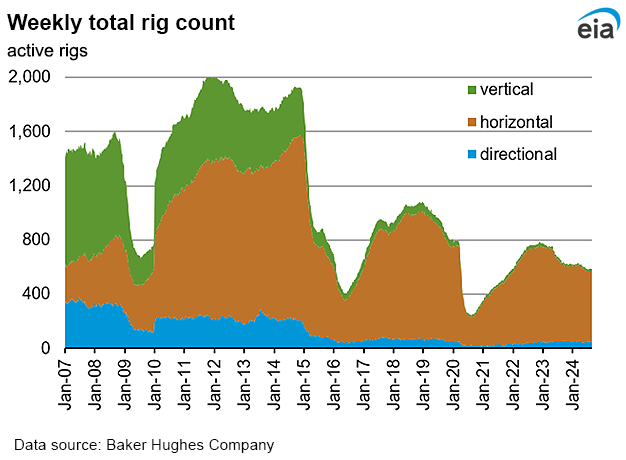
Rig Count
- According to Baker Hughes, for the week ending Tuesday, August 20, the natural gas rig count decreased by 1 rig from a week ago to 97 rigs. The Haynesville added one rig, and two rigs were dropped among unidentified producing regions. The number of oil-directed rigs was unchanged from a week ago at 483 rigs. The Arkoma Woodford, Eagle Ford, and Granite Wash each dropped one rig, and the Williston and Mississippian dropped two rigs each. The Cana Woodford added two rigs, the Permian added three rigs, and two rigs were added among unidentified producing regions. The total rig count, which includes 5 miscellaneous rigs, now stands at 585 rigs, down from 632 rigs a year ago.
Storage
- Net injections into storage totaled 35 Bcf for the week ending August 23, compared with the five-year (2019–2023) average net injections of 43 Bcf and last year's net injections of 28 Bcf during the same week. Working natural gas stocks totaled 3,334 Bcf, which is 361 Bcf (12%) more than the five-year average and 228 Bcf (7%) more than last year at this time.
- According to The Desk survey of natural gas analysts, estimates of the weekly net change to working natural gas stocks ranged from net injections of 31 Bcf to 52 Bcf, with a median estimate of 39 Bcf.
- The average rate of injections into storage is 20% lower than the five-year average so far in the refill season (April through October). If the rate of injections into storage matched the five-year average of 10.7 Bcf/d for the remainder of the refill season, the total inventory would be 4,073 Bcf on October 31, which is 361 Bcf higher than the five-year average of 3,712 Bcf for that time of year.
See also:
Top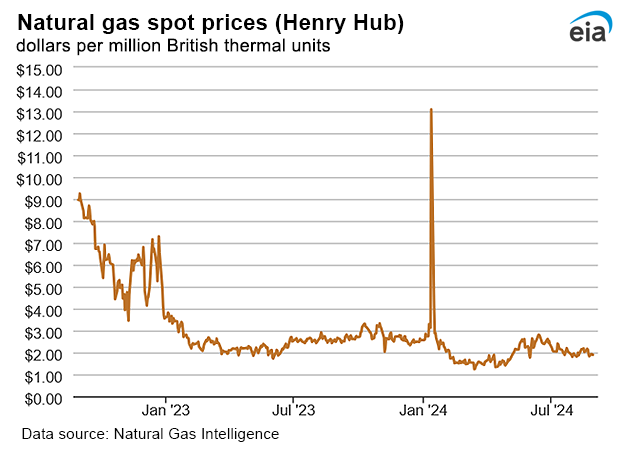
| Spot Prices ($/MMBtu) | Thu, 22-Aug |
Fri, 23-Aug |
Mon, 26-Aug |
Tue, 27-Aug |
Wed, 28-Aug |
|---|---|---|---|---|---|
| Henry Hub |
1.92 |
1.83 |
1.93 |
1.91 |
1.89 |
| New York |
1.24 |
1.42 |
1.79 |
1.80 |
1.43 |
| Chicago |
1.51 |
1.54 |
1.75 |
1.65 |
1.52 |
| Cal. Comp. Avg.* |
1.68 |
1.35 |
1.70 |
1.69 |
1.66 |
| U.S. natural gas supply - Gas Week: (8/22/24 - 8/28/24) | |||
|---|---|---|---|
Average daily values (billion cubic feet) |
|||
this week |
last week |
last year |
|
| Marketed production | 115.5 |
114.7 |
116.4 |
| Dry production | 102.0 |
101.3 |
103.6 |
| Net Canada imports | 6.9 |
6.4 |
5.7 |
| LNG pipeline deliveries | 0.1 |
0.1 |
0.1 |
| Total supply | 109.0 |
107.8 |
109.4 |
|
Data source: S&P Global Commodity Insights | |||
| U.S. natural gas consumption - Gas Week: (8/22/24 - 8/28/24) | |||
|---|---|---|---|
Average daily values (billion cubic feet) |
|||
this week |
last week |
last year |
|
| U.S. consumption | 74.3 |
74.1 |
78.8 |
| Power | 44.2 |
44.3 |
48.6 |
| Industrial | 21.7 |
21.7 |
22.0 |
| Residential/commercial | 8.5 |
8.1 |
8.2 |
| Mexico exports | 6.7 |
6.8 |
6.7 |
| Pipeline fuel use/losses | 6.7 |
6.7 |
7.1 |
| LNG pipeline receipts | 12.7 |
12.8 |
11.8 |
| Total demand | 100.3 |
100.4 |
104.4 |
|
Data source: S&P Global Commodity Insights | |||
| Rigs | |||
|---|---|---|---|
Tue, August 20, 2024 |
Change from |
||
|
last week
|
last year
|
||
| Oil rigs |
483
|
0.0%
|
-5.7%
|
| Natural gas rigs |
97
|
-1.0%
|
-15.7%
|
| Note: Excludes any miscellaneous rigs | |||
| Rig numbers by type | |||
|---|---|---|---|
Tue, August 20, 2024 |
Change from |
||
|
last week
|
last year
|
||
| Vertical |
14
|
-17.6%
|
-6.7%
|
| Horizontal |
524
|
0.6%
|
-7.6%
|
| Directional |
47
|
-2.1%
|
-6.0%
|
| Data source: Baker Hughes Company | |||
| Working gas in underground storage | ||||
|---|---|---|---|---|
Stocks billion cubic feet (Bcf) |
||||
| Region |
2024-08-23 |
2024-08-16 |
change |
|
| East |
754 |
735 |
19 |
|
| Midwest |
909 |
888 |
21 |
|
| Mountain |
266 |
263 |
3 |
|
| Pacific |
287 |
288 |
-1 |
|
| South Central |
1,119 |
1,125 |
-6 |
|
| Total |
3,334 |
3,299 |
35 |
|
|
Data source: U.S. Energy Information Administration Form EIA-912, Weekly Underground Natural Gas Storage Report
Note: Totals may not equal sum of components because of independent rounding. | ||||
| Working gas in underground storage | |||||
|---|---|---|---|---|---|
Historical comparisons |
|||||
Year ago 8/23/23 |
5-year average 2019-2023 |
||||
| Region | Stocks (Bcf) |
% change |
Stocks (Bcf) |
% change |
|
| East |
745 |
1.2 |
696 |
8.3 |
|
| Midwest |
847 |
7.3 |
816 |
11.4 |
|
| Mountain |
211 |
26.1 |
188 |
41.5 |
|
| Pacific |
246 |
16.7 |
263 |
9.1 |
|
| South Central | 1,056 |
6.0 |
1,010 |
10.8 |
|
| Total | 3,106 |
7.3 |
2,973 |
12.1 |
|
| Data source: U.S. Energy Information Administration Form EIA-912, Weekly Underground Natural Gas Storage Report
Note: Totals may not equal sum of components because of independent rounding. |
|||||
| Temperature – heating & cooling degree days (week ending Aug 22) | ||||||||
|---|---|---|---|---|---|---|---|---|
HDDs |
CDDs |
|||||||
| Region | Current total |
Deviation from normal |
Deviation from last year |
Current total |
Deviation from normal |
Deviation from last year |
||
| New England | 10 |
5 |
6 |
16 |
-14 |
-9 |
||
| Middle Atlantic | 6 |
3 |
3 |
33 |
-11 |
-4 |
||
| E N Central | 13 |
7 |
8 |
28 |
-14 |
-16 |
||
| W N Central | 4 |
-3 |
2 |
48 |
-8 |
-33 |
||
| South Atlantic | 2 |
2 |
2 |
80 |
-7 |
-12 |
||
| E S Central | 2 |
2 |
2 |
80 |
-4 |
-13 |
||
| W S Central | 0 |
0 |
0 |
142 |
23 |
-10 |
||
| Mountain | 0 |
-9 |
-1 |
78 |
10 |
11 |
||
| Pacific | 2 |
-2 |
0 |
46 |
3 |
2 |
||
| United States | 5 |
1 |
3 |
61 |
-4 |
-9 |
||
|
Data source: National Oceanic and Atmospheric Administration Note: HDDs=heating degree days; CDDs=cooling degree days | ||||||||
Average temperature (°F)
7-day mean ending Aug 22, 2024
Data source: National Oceanic and Atmospheric Administration
Deviation between average and normal temperature (°F)
7-day mean ending Aug 22, 2024
Data source: National Oceanic and Atmospheric Administration
Monthly U.S. dry shale natural gas production by formation is available in the Short-Term Energy Outlook.