Today in Energy
Recent Today in Energy analysis of natural gas markets is available on the EIA website.
Market Highlights:
(For the week ending Wednesday, April 23, 2025)Prices
- Henry Hub spot price: The Henry Hub spot price fell 28 cents from $3.21 per million British thermal units (MMBtu) last Wednesday to $2.93/MMBtu yesterday.
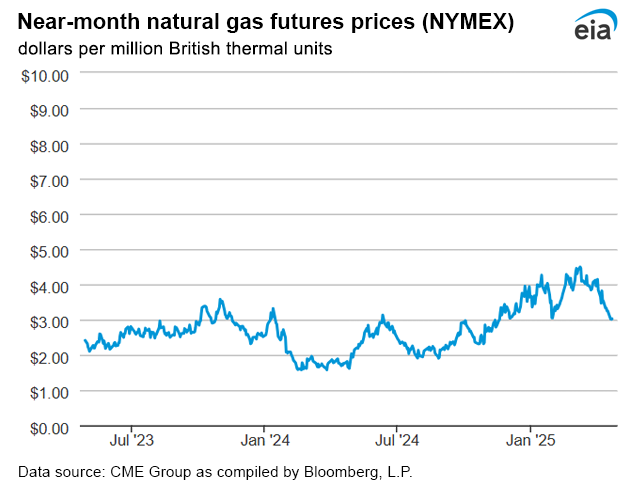
- Henry Hub futures price: The price of the May 2025 NYMEX contract decreased 23 cents, from $3.247/MMBtu last Wednesday to $3.022/MMBtu yesterday. The price of the 12-month strip averaging May 2025 through April 2026 futures contracts declined 17 cents to $3.756/MMBtu.
- Select regional spot prices: Natural gas spot prices fell at most locations this report week (Wednesday, April 16, to Wednesday, April 23). Price changes ranged from a decrease of $1.33 at the Waha Hub to an increase of 11 cents at Houston Ship Channel.
- Prices in the Northeast decreased this week as temperatures increased, resulting in lower natural gas consumption. At the Algonquin Citygate, which serves Boston-area consumers, the price went down 68 cents from $2.87/MMBtu last Wednesday to $2.19/MMBtu yesterday. At the Transco Zone 6 NY trading point for New York City, the price decreased 65 cents from $2.73/MMBtu last Wednesday to $2.08/MMBtu yesterday. Average temperatures in the Boston Area increased 11°F this report week from an average of 45°F last Wednesday to 56°F yesterday, resulting in 72 fewer heating degree days (HDD). Similarly, temperatures in the New York Central Park Area increased 14°F this week from an average of 48°F last Wednesday to 62°F yesterday. Consumption of natural gas in the residential and commercial sector in the Northeast decreased this report week by 51% (4.6 billion cubic feet per day [Bcf/d]), according to data from S&P Global Commodity Insights.
- International futures prices: International natural gas futures price changes were mixed this report week. According to Bloomberg Finance, L.P., weekly average front-month futures prices for liquefied natural gas (LNG) cargoes in East Asia decreased 50 cents to a weekly average of $11.90/MMBtu. Natural gas futures for delivery at the Title Transfer Facility (TTF) in the Netherlands increased 33 cents to a weekly average of $11.68/MMBtu. In the same week last year (week ending April 24, 2024), the prices were $10.51/MMBtu in East Asia and $9.38/MMBtu at TTF. Top
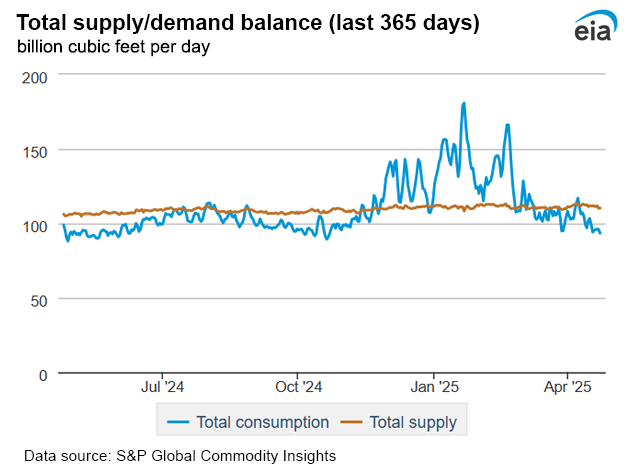
- Supply: According to data from S&P Global Commodity Insights, the average total supply of natural gas fell by 0.9% (1.0 Bcf/d) compared with the previous report week. Dry natural gas production remained unchanged at 106.3 Bcf/d, and average net imports from Canada decreased by 16.3% (1.0 Bcf/d) from last week.
- Demand: Total U.S. consumption of natural gas fell by 8.7% (6.3 Bcf/d) compared with the previous report week, according to data from S&P Global Commodity Insights, as temperatures across most of the United States were above average. Consumption in the residential and commercial sector declined by 31.7% (6.7 Bcf/d) week over week and consumption in the industrial sector decreased by 2.6% (0.6 Bcf/d). Natural gas consumed for power generation rose by 3.3% (0.9 Bcf/d). Natural gas exports to Mexico increased 1.4% (0.1 Bcf/d). Natural gas deliveries to U.S. LNG export facilities (LNG pipeline receipts) averaged 16.1 Bcf/d, or 0.7 Bcf/d lower than last week.
Daily spot prices by region are available on the EIA website.
Supply and Demand
Liquefied Natural Gas (LNG)
- Pipeline receipts: Average natural gas deliveries to U.S. LNG export terminals decreased 0.7 Bcf/d from last week to 16.1 Bcf/d this week, according to data from S&P Global Commodity Insights. Natural gas deliveries to terminals in South Louisiana decreased 6.7% (0.7 Bcf/d) to 10.3 Bcf/d, and natural gas deliveries to terminals in South Texas were essentially unchanged this week, averaging 4.6 Bcf/d. Natural gas deliveries to terminals outside the Gulf Coast were essentially unchanged at 1.2 Bcf/d this week.
- Vessels departing U.S. ports: Twenty-seven LNG vessels (eight from Sabine Pass; four each from Cameron, Corpus Christi, and Freeport; three from Plaquemines; and two each from Calcasieu Pass and Cove Point) with a combined LNG-carrying capacity of 102 Bcf departed the United States between April 17 and April 23, according to shipping data provided by Bloomberg Finance, L.P.
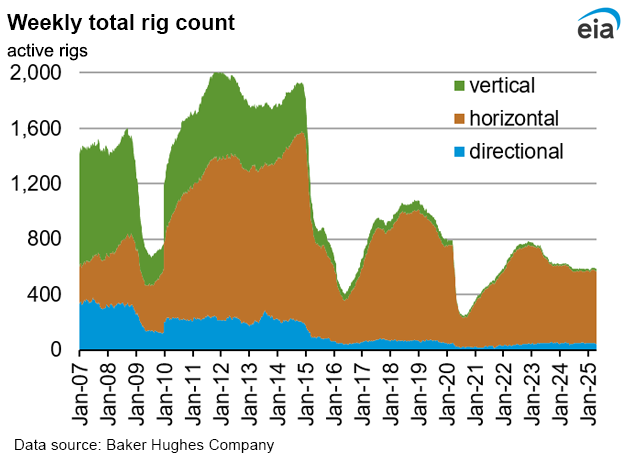
Rig Count
- According to Baker Hughes, for the week ending Tuesday, April 15, the natural gas rig count increased by 1 rig from a week ago to 98 rigs. The Marcellus added one rig, the Utica added two rigs, and two rigs were dropped among unidentified producing regions. The number of oil-directed rigs rose by 1 rig to 481 rigs, as the Cana Woodford added 1 rig. The total rig count, which includes 6 miscellaneous rigs, now stands at 585 rigs, 34 fewer rigs than last year at this time.
Storage
- Net injections into storage totaled 88 Bcf for the week ending April 18, compared with the five-year (2020–24) average net injections of 58 Bcf and last year's net injections of 86 Bcf during the same week. Working natural gas stocks totaled 1,934 Bcf, which is 44 Bcf (2%) lower than the five-year average and 478 Bcf (20%) lower than last year at this time.
- According to The Desk survey of natural gas analysts, estimates of the weekly net change to working natural gas stocks ranged from net injections of 56 Bcf to 81 Bcf, with a median estimate of 72 Bcf.
See also:
Top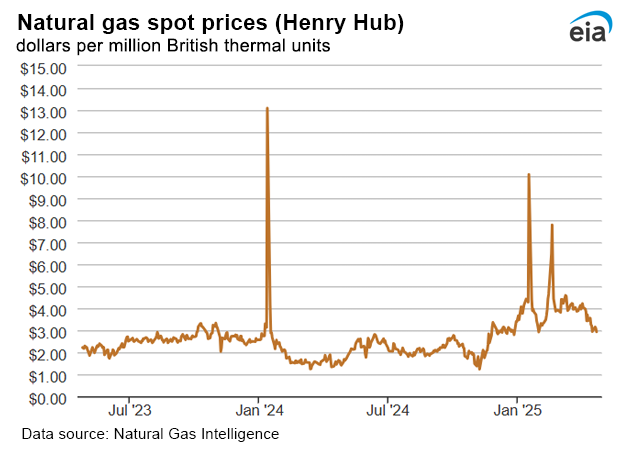
| Spot Prices ($/MMBtu) | Thu, 17-Apr |
Fri, 18-Apr |
Mon, 21-Apr |
Tue, 22-Apr |
Wed, 23-Apr |
|---|---|---|---|---|---|
| Henry Hub | 2.94 | Holiday | 3.15 | 3.08 | 2.93 |
| New York | 2.14 | Holiday | 2.25 | 2.20 | 2.08 |
| Chicago | 2.57 | Holiday | 2.60 | 2.55 | 2.47 |
| Cal. Comp. Avg.* | 1.94 | Holiday | 2.01 | 1.99 | 2.00 |
| *Avg. of NGI's reported prices for: Malin, PG&E Citygate, and Southern California Border Avg. | |||||
| Data source: NGI's Daily Gas Price Index | |||||
| U.S. natural gas supply - Gas Week: (4/17/25 - 4/23/25) | |||
|---|---|---|---|
Average daily values (billion cubic feet) |
|||
this week |
last week |
last year |
|
| Marketed production | 120.2 |
120.2 |
113.6 |
| Dry production | 106.3 |
106.3 |
100.8 |
| Net Canada imports | 5.0 |
5.9 |
5.0 |
| LNG pipeline deliveries | 0.0 |
0.0 |
0.1 |
| Total supply | 111.3 |
112.3 |
105.9 |
|
Data source: S&P Global Commodity Insights | |||
| U.S. natural gas consumption - Gas Week: (4/17/25 - 4/23/25) | |||
|---|---|---|---|
Average daily values (billion cubic feet) |
|||
this week |
last week |
last year |
|
| U.S. consumption | 66.5 |
72.8 |
71.7 |
| Power | 29.5 |
28.6 |
29.7 |
| Industrial | 22.6 |
23.3 |
23.2 |
| Residential/commercial | 14.4 |
21.0 |
18.8 |
| Mexico exports | 6.4 |
6.3 |
6.7 |
| Pipeline fuel use/losses | 6.7 |
6.9 |
6.6 |
| LNG pipeline receipts | 16.1 |
16.8 |
10.7 |
| Total demand | 95.7 |
102.8 |
95.6 |
|
Data source: S&P Global Commodity Insights | |||
| Rigs | |||
|---|---|---|---|
Tue, April 15, 2025 |
Change from |
||
|
last week
|
last year
|
||
| Oil rigs |
481
|
0.2%
|
-5.9%
|
| Natural gas rigs |
98
|
1.0%
|
-7.5%
|
| Note: Excludes any miscellaneous rigs | |||
| Rig numbers by type | |||
|---|---|---|---|
Tue, April 15, 2025 |
Change from |
||
|
last week
|
last year
|
||
| Vertical |
14
|
0.0%
|
0.0%
|
| Horizontal |
527
|
0.8%
|
-5.0%
|
| Directional |
44
|
-4.3%
|
-12.0%
|
| Data source: Baker Hughes Company | |||
| Working gas in underground storage | ||||
|---|---|---|---|---|
Stocks billion cubic feet (Bcf) |
||||
| Region |
2025-04-18 |
2025-04-11 |
change |
|
| East |
295 |
290 |
5 |
|
| Midwest |
396 |
373 |
23 |
|
| Mountain |
171 |
166 |
5 |
|
| Pacific |
221 |
213 |
8 |
|
| South Central |
851 |
804 |
47 |
|
| Total |
1,934 |
1,846 |
88 |
|
|
Data source: U.S. Energy Information Administration Form EIA-912, Weekly Underground Natural Gas Storage Report Note: Totals may not equal sum of components because of independent rounding. | ||||
| Working gas in underground storage | |||||
|---|---|---|---|---|---|
Historical comparisons |
|||||
Year ago 4/18/24 |
5-year average 2020-2024 |
||||
| Region | Stocks (Bcf) |
% change |
Stocks (Bcf) |
% change |
|
| East |
404 |
-27.0 |
349 |
-15.5 |
|
| Midwest |
548 |
-27.7 |
446 |
-11.2 |
|
| Mountain |
172 |
-0.6 |
113 |
51.3 |
|
| Pacific |
234 |
-5.6 |
183 |
20.8 |
|
| South Central | 1,053 |
-19.2 |
887 |
-4.1 |
|
| Total | 2,412 |
-19.8 |
1,978 |
-2.2 |
|
| Data source: U.S. Energy Information Administration Form EIA-912, Weekly Underground Natural Gas Storage Report
Note: Totals may not equal sum of components because of independent rounding. |
|||||
| Temperature – heating & cooling degree days (week ending Apr 17) | ||||||||
|---|---|---|---|---|---|---|---|---|
HDDs |
CDDs |
|||||||
| Region | Current total |
Deviation from normal |
Deviation from last year |
Current total |
Deviation from normal |
Deviation from last year |
||
| New England | 145 |
8 |
44 |
0 |
0 |
0 |
||
| Middle Atlantic | 131 |
12 |
66 |
0 |
0 |
0 |
||
| E N Central | 127 |
5 |
62 |
0 |
0 |
-1 |
||
| W N Central | 87 |
-27 |
23 |
1 |
0 |
-5 |
||
| South Atlantic | 72 |
14 |
50 |
10 |
-4 |
-8 |
||
| E S Central | 64 |
11 |
36 |
1 |
-4 |
-9 |
||
| W S Central | 12 |
-12 |
-4 |
37 |
17 |
4 |
||
| Mountain | 70 |
-44 |
-20 |
14 |
7 |
10 |
||
| Pacific | 54 |
-13 |
-18 |
0 |
-3 |
0 |
||
| United States | 88 |
-4 |
30 |
7 |
1 |
-1 |
||
|
Data source: National Oceanic and Atmospheric Administration Note: HDDs=heating degree days; CDDs=cooling degree days | ||||||||
Average temperature (°F)
7-day mean ending Apr 17, 2025
Data source: National Oceanic and Atmospheric Administration
Deviation between average and normal temperature (°F)
7-day mean ending Apr 17, 2025
Data source: National Oceanic and Atmospheric Administration
Monthly U.S. dry shale natural gas production by formation is available in the
Short-Term Energy Outlook.