Today in Energy
Recent Today in Energy analysis of natural gas markets is available on the EIA website.
Market Highlights:
(For the week ending Wednesday, October 2, 2024)Prices
- Henry Hub spot price: The Henry Hub spot price rose 14 cents from $2.62 per million British thermal units (MMBtu) last Wednesday to $2.76/MMBtu yesterday.
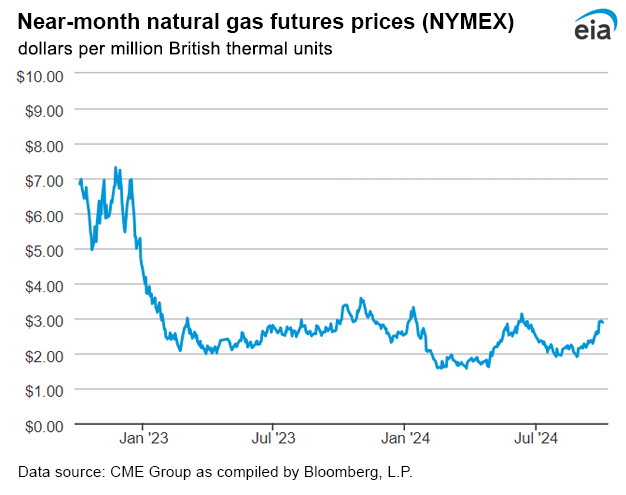
- Henry Hub futures price: The October 2024 NYMEX contract expired last Thursday at $2.585/MMBtu, down 5 cents from last Wednesday. The November 2024 NYMEX contract price increased to $2.886/MMBtu, up 7 cents from last Wednesday to yesterday. The price of the 12-month strip averaging November 2024 through October 2025 futures contracts climbed 5 cents to $3.246/MMBtu.
- Select regional spot prices: Natural gas spot prices rose at most locations this report week (Wednesday, September 25 to Wednesday, October 2). Price changes ranged from a decrease of 35 cents at the Algonquin Citygate in the Northeast to an increase of $1.44 at the Waha Hub.
- Prices in the Northeast fell this report week. The price at the Algonquin Citygate, which serves Boston-area consumers, fell 35 cents from $1.97/MMBtu last week to $1.62/MMBtu yesterday. At the Transco Zone 6 NY trading point for New York City, the price fell 15 cents from $1.62/MMBtu last Wednesday to $1.47/MMBtu yesterday. Temperatures in the New York-Central Park Area averaged 65°F, resulting in 9 cooling degree days (CDDs), 20 fewer CDDs than last week. Consumption of natural gas in the electric power sector in New York and New Jersey fell 12% (0.2 billion cubic feet per day [Bcf/d]), according to data from S&P Global Commodity Insights.
- Prices in California increased this report week. The price at PG&E Citygate in Northern California rose $1.27 from $2.98/MMBtu last week to $4.25/MMBtu yesterday. The price at SoCal Citygate in Southern California increased $1.43 from $2.43/MMBtu last Wednesday to $3.86/MMBtu yesterday. Temperatures in the Riverside Area, east of Los Angeles, averaged 77°F this report week, compared with 72°F last week, resulting in 85 CDDs, 33 CDDs more than last week. Temperatures in the Sacramento Area followed a similar trend, averaging 75°F this week, resulting in 69 CDDs, 32 more CDDs than normal for this time of year. Natural gas consumption in the electric power sector in California rose 34% (0.5 Bcf/d) this report week, according to data from S&P Global Commodity Insights.
- At Northwest Sumas on the Canada-Washington border, the main pricing point for natural gas in the Pacific Northwest, the price rose $1.10 from $2.15/MMBtu last Wednesday to $3.25/MMBtu yesterday. Prices at Northwest Sumas were above $3.00/MMBtu starting Monday for the first time since January of this year. As of September 30, available throughput capacity was reduced by approximately 32% (0.5 Bcf/d) at Station 4B South on the Westcoast Energy pipeline system in British Columbia, which is operated by Enbridge. Temperatures decreased in the Seattle area, averaging 58°F this report week compared with 63°F last week and in line with average temperatures for this time of year, which resulted in 38 HDDs, 19 more HDDs than last week. Total natural gas consumption in the Pacific Northwest was largely flat, but consumption in the residential and commercial sector did increase this week by 37% (0.1 Bcf/d), according to data from S&P Global Commodity Insights.
- Prices in the Southeast rose this report week in line with the Henry Hub price. The Houston Ship Channel price rose 12 cents from $2.53/MMBtu last Wednesday to $2.65/MMBtu yesterday. The price at FGT Citygate, which delivers natural gas into Florida, rose 28 cents from $3.42/MMBtu last Wednesday to $3.70/MMBtu yesterday. Hurricane Helene made landfall on September 27 in Florida as a Category 4 hurricane. As of October 2, slightly under a million customers were still without power in South Carolina, Georgia, North Carolina, Florida, and Virginia. Natural gas consumption in the electric power sector in the Southern Corridor decreased 20% (0.6 Bcf/d) this report week, according to data from S&P Global Commodity Insights.
- The price at the Waha Hub in West Texas, which is located near Permian Basin production activities, increased $1.44 from $0.03/MMBtu last Wednesday to $1.47/MMBtu yesterday, its highest price since July 10 when it reached $1.54/MMBtu. The Waha Hub price traded $1.29 below the Henry Hub price yesterday, compared with last Wednesday when it traded $2.59 below the Henry Hub price. The Matterhorn Pipeline began delivering natural gas to pipeline interconnects in the Houston area this week. Over two days, October 1 and October 2, deliveries to the Transcontinental Pipeline Company (Transco) averaged 0.3 Bcf/d and deliveries to Texas Eastern Transmission Company (TETCO) averaged 0.2 Bcf/d.
- International futures prices: International natural gas futures prices increased this report week. According to Bloomberg Finance, L.P., weekly average front-month futures prices for liquefied natural gas (LNG) cargoes in East Asia increased 13 cents to a weekly average of $13.16/MMBtu. Natural gas futures for delivery at the Title Transfer Facility (TTF) in the Netherlands increased $1.04/MMBtu to a weekly average of $12.58/MMBtu. In the same week last year (week ending October 4, 2023), the prices were $14.44/MMBtu in East Asia and $12.11/MMBtu at TTF.
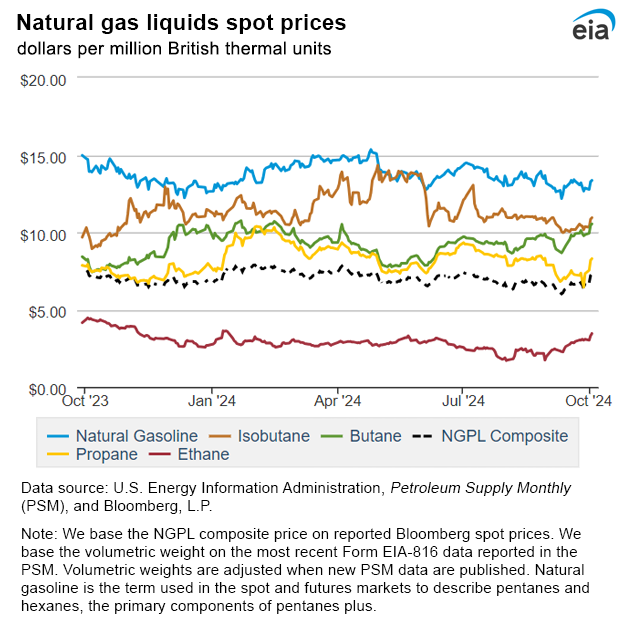
- Natural gas plant liquids (NGPL) prices: The natural gas plant liquids composite price at Mont Belvieu, Texas, rose by 20 cents/MMBtu, averaging $6.86/MMBtu for the week ending October 2. Ethane prices rose 6% week over week, while weekly average natural gas prices at the Houston Ship Channel increased 15%, narrowing the ethane premium to natural gas by 19%. The ethylene spot price fell 16% week over week, and the ethylene premium to ethane decreased 21%. Propane prices increased 5%, while Brent crude oil prices decreased 2% week over week, narrowing the propane discount to crude oil by 13%. Normal butane and isobutane prices each rose 2%, and natural gasoline prices fell 1%.
Daily spot prices by region are available on the EIA website.
Supply and Demand
- Supply: According to data from S&P Global Commodity Insights, the average total supply of natural gas rose by 0.3% (0.3 Bcf/d) compared with the previous report week. Dry natural gas production grew by 0.5% (0.5 Bcf/d) to average 101.7 Bcf/d, and average net imports from Canada decreased by 3.5% (0.2 Bcf/d) from last week.
- Demand: Total U.S. consumption of natural gas fell by 3.1% (2.3 Bcf/d) compared with the previous report week, according to data from S&P Global Commodity Insights. Natural gas consumed for power generation declined by 6.8% (2.8 Bcf/d) week over week. Consumption in the industrial sector increased by 1.3% (0.3 Bcf/d), and consumption in the residential and commercial sector increased by 2.9% (0.3 Bcf/d) week over week. Natural gas exports to Mexico decreased 3.5% (0.2 Bcf/d). Natural gas deliveries to U.S. LNG export facilities (LNG pipeline receipts) averaged 12.4 Bcf/d, or 0.2 Bcf/d lower than last week.
Liquefied Natural Gas (LNG)
- Pipeline receipts: Average natural gas deliveries to U.S. LNG export terminals decreased by 0.2 Bcf/d from last week to 12.4 Bcf/d, according to data from S&P Global Commodity Insights. Natural gas deliveries to terminals in South Louisiana decreased by 1.8% (0.1 Bcf/d) to 7.6 Bcf/d, while natural gas deliveries to terminals in South Texas increased by 0.6% (less than 0.1 Bcf/d) to 4.4 Bcf/d. Natural gas deliveries to terminals outside the Gulf Coast decreased by 27.7% (0.1 Bcf/d) to 0.3 Bcf/d.
- Vessels departing U.S. ports: Twenty-five LNG vessels (seven from Sabine Pass, five from Freeport, four each from Cameron and Corpus Christi, three from Calcasieu Pass, and two from Elba Island) with a combined LNG-carrying capacity of 94 Bcf departed the United States between September 26 and October 2, according to shipping data provided by Bloomberg Finance, L.P.
Rig Count
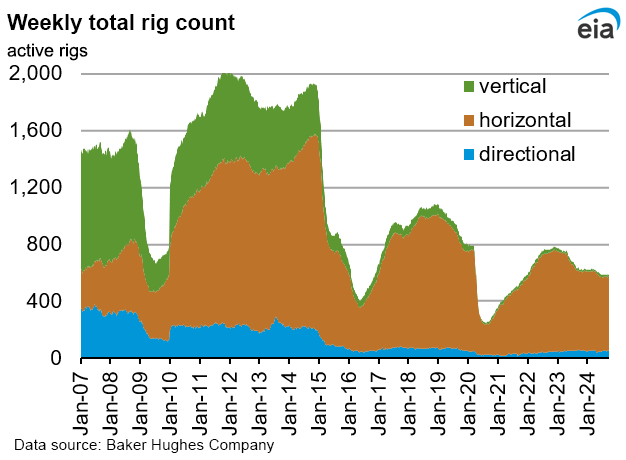
- According to Baker Hughes, for the week ending Tuesday, September 24, the natural gas rig count increased by 3 rigs from a week ago to 99 rigs as 1 rig each was added in the Permian, Williston, and other unidentified producing regions. The number of oil-directed rigs was down 4 rigs from a week ago to 484 rigs. The Permian dropped two rigs, and the Cana Woodford, Granite Wash, and Williston each dropped one rig. One rig was added among unidentified producing regions. The total rig count, which includes 4 miscellaneous rigs, now stands at 587 rigs, 36 fewer rigs than a year ago.
Storage
- Net injections into storage totaled 55 Bcf for the week ending September 27, compared with the five-year (2019–2023) average net injections of 98 Bcf and last year's net injections of 87 Bcf during the same week. Working natural gas stocks totaled 3,547 Bcf, which is 190 Bcf (6%) more than the five-year average and 127 Bcf (4%) more than last year at this time.
- According to The Desk survey of natural gas analysts, estimates of the weekly net change to working natural gas stocks ranged from net injections of 49 Bcf to 62 Bcf, with a median estimate of 57 Bcf.
- The average rate of injections into storage is 26% lower than the five-year average so far in the refill season (April through October). If the rate of injections into storage matched the five-year average of 10.5 Bcf/d for the remainder of the refill season, the total inventory would be 3,902 Bcf on October 31, which is 190 Bcf higher than the five-year average of 3,712 Bcf for that time of year.
See also:
Top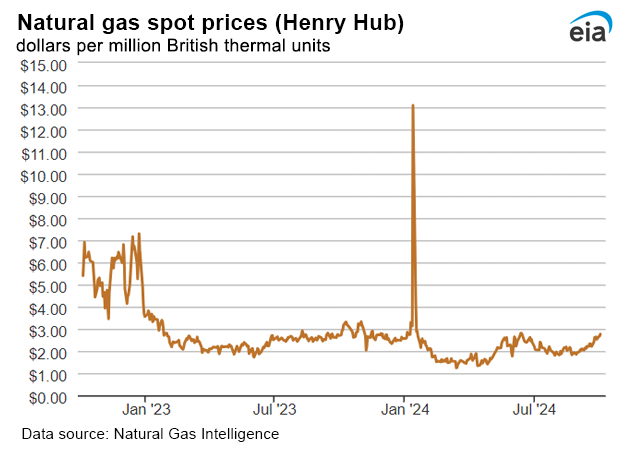
| Spot Prices ($/MMBtu) | Thu, 26-Sep |
Fri, 27-Sep |
Mon, 30-Sep |
Tue, 01-Oct |
Wed, 02-Oct |
|---|---|---|---|---|---|
| Henry Hub |
2.64 |
2.53 |
2.66 |
2.67 |
2.76 |
| New York |
1.34 |
1.34 |
1.43 |
1.43 |
1.47 |
| Chicago |
2.32 |
2.21 |
2.39 |
2.48 |
2.52 |
| Cal. Comp. Avg.* |
2.50 |
2.54 |
3.66 |
3.52 |
3.68 |
| *Avg. of NGI's reported prices for: Malin, PG&E Citygate, and Southern California Border Avg. | |||||
| Data Source: NGI's Daily Gas Price Index | |||||
| U.S. natural gas supply - Gas Week: (9/26/24 - 10/2/24) | |||
|---|---|---|---|
Average daily values (billion cubic feet) |
|||
this week |
last week |
last year |
|
| Marketed production | 115.6 |
114.9 |
115.9 |
| Dry production | 101.7 |
101.2 |
102.8 |
| Net Canada imports | 5.7 |
5.9 |
5.3 |
| LNG pipeline deliveries | 0.1 |
0.1 |
0.1 |
| Total supply | 107.4 |
107.1 |
108.1 |
|
Data source: S&P Global Commodity Insights | |||
| U.S. natural gas consumption - Gas Week: (9/26/24 - 10/2/24) | |||
|---|---|---|---|
Average daily values (billion cubic feet) |
|||
this week |
last week |
last year |
|
| U.S. consumption | 70.2 |
72.5 |
68.3 |
| Power | 38.6 |
41.4 |
37.1 |
| Industrial | 22.1 |
21.9 |
22.0 |
| Residential/commercial | 9.4 |
9.2 |
9.2 |
| Mexico exports | 6.7 |
6.9 |
6.9 |
| Pipeline fuel use/losses | 6.6 |
6.6 |
6.7 |
| LNG pipeline receipts | 12.4 |
12.6 |
12.3 |
| Total demand | 95.9 |
98.6 |
94.1 |
|
Data source: S&P Global Commodity Insights | |||

| Rigs | |||
|---|---|---|---|
Tue, September 24, 2024 |
Change from |
||
|
last week
|
last year
|
||
| Oil rigs |
484
|
-0.8%
|
-3.6%
|
| Natural gas rigs |
99
|
3.1%
|
-14.7%
|
| Note: Excludes any miscellaneous rigs | |||
| Rig numbers by type | |||
|---|---|---|---|
Tue, September 24, 2024 |
Change from |
||
|
last week
|
last year
|
||
| Vertical |
14
|
-6.7%
|
-6.7%
|
| Horizontal |
523
|
0.0%
|
-5.4%
|
| Directional |
50
|
0.0%
|
-9.1%
|
| Data source: Baker Hughes Company | |||
| Working gas in underground storage | ||||
|---|---|---|---|---|
Stocks billion cubic feet (Bcf) |
||||
| Region |
2024-09-27 |
2024-09-20 |
change |
|
| East |
846 |
818 |
28 |
|
| Midwest |
1,013 |
993 |
20 |
|
| Mountain |
283 |
279 |
4 |
|
| Pacific |
293 |
289 |
4 |
|
| South Central |
1,113 |
1,113 |
0 |
|
| Total |
3,547 |
3,492 |
55 |
|
|
Data source: U.S. Energy Information Administration Form EIA-912, Weekly Underground Natural Gas Storage Report Note: Totals may not equal sum of components because of independent rounding. | ||||
| Working gas in underground storage | |||||
|---|---|---|---|---|---|
Historical comparisons |
|||||
Year ago 9/27/23 |
5-year average 2019-2023 |
||||
| Region | Stocks (Bcf) |
% change |
Stocks (Bcf) |
% change |
|
| East |
840 |
0.7 |
815 |
3.8 |
|
| Midwest |
983 |
3.1 |
969 |
4.5 |
|
| Mountain |
238 |
18.9 |
211 |
34.1 |
|
| Pacific |
276 |
6.2 |
275 |
6.5 |
|
| South Central | 1,085 |
2.6 |
1,087 |
2.4 |
|
| Total | 3,420 |
3.7 |
3,357 |
5.7 |
|
| Data source: U.S. Energy Information Administration Form EIA-912, Weekly Underground Natural Gas Storage Report
Note: Totals may not equal sum of components because of independent rounding. |
|||||
| Temperature – heating & cooling degree days (week ending Sep 26) | ||||||||
|---|---|---|---|---|---|---|---|---|
HDDs |
CDDs |
|||||||
| Region | Current total |
Deviation from normal |
Deviation from last year |
Current total |
Deviation from normal |
Deviation from last year |
||
| New England | 40 |
-7 |
-12 |
0 |
-1 |
0 |
||
| Middle Atlantic | 15 |
-22 |
-22 |
6 |
-1 |
6 |
||
| E N Central | 14 |
-26 |
-4 |
20 |
13 |
9 |
||
| W N Central | 23 |
-20 |
11 |
24 |
12 |
-7 |
||
| South Atlantic | 1 |
-13 |
-12 |
70 |
19 |
25 |
||
| E S Central | 1 |
-12 |
-1 |
72 |
35 |
22 |
||
| W S Central | 1 |
-3 |
1 |
95 |
28 |
-16 |
||
| Mountain | 27 |
-19 |
-9 |
33 |
2 |
6 |
||
| Pacific | 6 |
-8 |
-8 |
23 |
-1 |
19 |
||
| United States | 12 |
-16 |
-7 |
40 |
12 |
9 |
||
|
Data source: National Oceanic and Atmospheric Administration Note: HDDs=heating degree days; CDDs=cooling degree days | ||||||||
Average temperature (°F)
7-day mean ending Sep 26, 2024
Data source: National Oceanic and Atmospheric Administration
Deviation between average and normal temperature (°F)
7-day mean ending Sep 26, 2024
Data source: National Oceanic and Atmospheric Administration
Monthly U.S. dry shale natural gas production by formation is available in the Short-Term Energy Outlook.