Today in Energy
Recent Today in Energy analysis of natural gas markets is available on the EIA website.
Market Highlights:
(For the week ending Wednesday, August 7, 2024)Prices
- Henry Hub spot price: The Henry Hub spot price rose 6 cents from $1.93 per million British thermal units (MMBtu) last Wednesday to $1.99/MMBtu yesterday.
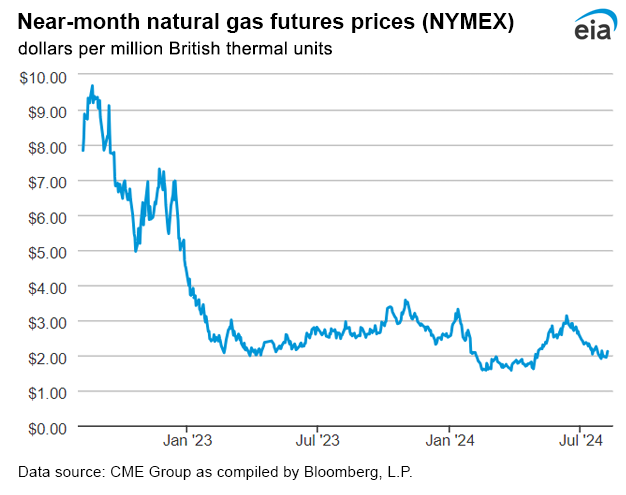
- Henry Hub futures price: The price of the September 2024 NYMEX contract increased 7.6 cents, from $2.036/MMBtu last Wednesday to $2.112/MMBtu yesterday. The price of the 12-month strip averaging September 2024 through August 2025 futures contracts rose 3.4 cents to $2.939/MMBtu.
- Select regional spot prices: Natural gas spot prices fell at most locations this report week (Wednesday, July 31, to Wednesday, August 7). Price changes ranged from a decrease of 82 cents at the Algonquin Citygate to an increase of 11 cents at the Houston Ship Channel.
- Prices in the Northeast decreased this report week as temperatures decreased toward the end of the week, despite an overall weekly increase in natural gas use for electric power generation. At the Algonquin Citygate, which serves Boston-area consumers, the price fell 82 cents from $2.30/MMBtu last Wednesday to $1.48/MMBtu yesterday. The price at Eastern Gas South in southwest Pennsylvania decreased 13 cents from $1.47/MMBtu last Wednesday to $1.34/MMBtu yesterday. Consumption of natural gas in the electric power sector increased 8% (1.0 billion cubic feet per day [Bcf/d]) in the Northeast this week, according to data from S&P Global Commodity Insights. Temperatures in the Boston Area averaged 85°F early in the report week on August 1 but declined to an average of 64°F yesterday.
- Prices in the West decreased this report week, despite an increase in natural gas consumption. The price at Northwest Sumas on the Canada-Washington border, the main pricing point for natural gas in the Pacific Northwest, fell 33 cents from $1.80/MMBtu last Wednesday to $1.48/MMBtu yesterday. The price at PG&E Citygate in Northern California fell 70 cents from $3.75/MMBtu last Wednesday to $3.05/MMBtu yesterday. The price at SoCal Citygate in Southern California decreased 45 cents from $2.74/MMBtu last Wednesday to $2.29/MMBtu yesterday. Total consumption of natural gas in the Western region increased 7% (0.7 Bcf/d) this week driven by a 12% (0.7 Bcf/d) increase in the electric power sector. Average temperatures in the Riverside Area, inland from Los Angeles, increased 5°F this report week, resulting in an increase of 37 cooling degree days (CDD) from last week. Total inventory of natural gas was reported by SoCalGas to be 106.1 Bcf as of August 8, which is over 77% of the nominal capacity.
- The price at the Florida Gas Transmission (FGT) Citygate increased 7 cents this report week from $2.65/MMBtu last Wednesday to $2.72/MMBtu yesterday driven by high temperatures. Average temperatures in the Orlando Area hit a weekly low of 81°F on Monday when Tropical Storm Debby made landfall in Florida, but they increased to 89°F yesterday, 6°F above normal. The National Weather Service issued a Heat Advisory stating its expectation of a heat index of up to 110°F on August 8 in Orlando.
- Prices in eastern Texas increased this report week, driven by both increased demand and decreased production of natural gas. The price at the Henry Hub rose 6 cents from $1.93/MMBtu last Wednesday to $1.99/MMBtu yesterday. The Houston Ship Channel price rose 11 cents from $1.73/MMBtu last Wednesday to $1.84/MMBtu yesterday. A heat wave drove higher consumption of natural gas in the electric power sector in Texas, which increased 20% (1.3 Bcf/d) this week, according to data from S&P Global Commodity Insights. At the same time, production of natural gas in South Texas declined 3% (0.2 Bcf/d).
- International futures prices: International natural gas futures prices increased this report week. According to Bloomberg Finance, L.P., weekly average front-month futures prices for liquefied natural gas (LNG) cargoes in East Asia increased 15 cents to a weekly average of $12.50/MMBtu. Natural gas futures for delivery at the Title Transfer Facility (TTF) in the Netherlands increased $1.08/MMBtu to a weekly average of $11.78/MMBtu. In the same week last year (week ending August 9, 2023), the prices were $10.98/MMBtu in East Asia and $10.35/MMBtu at TTF.
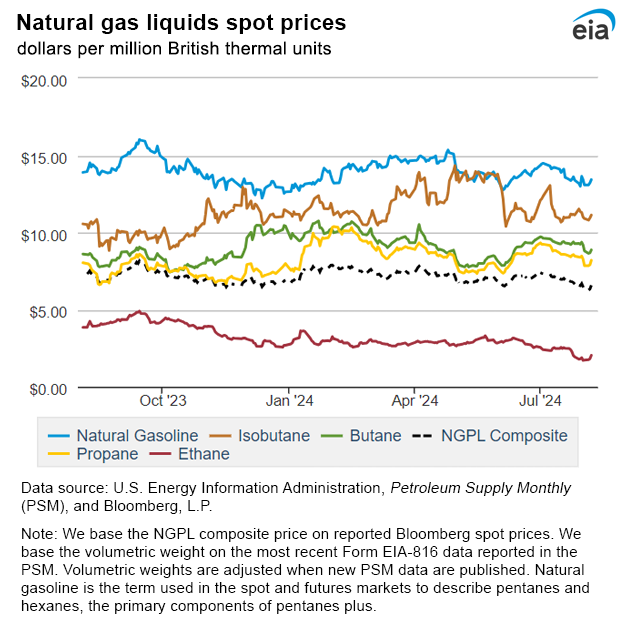
- Natural gas plant liquids (NGPL) prices: The natural gas plant liquids composite price at Mont Belvieu, Texas, fell by 25 cents/MMBtu, averaging $6.39/MMBtu for the week ending August 7. Ethane prices fell 4% week over week, while weekly average natural gas prices at the Houston Ship Channel increased 8%, narrowing the ethane premium to natural gas by 78%. The ethylene spot price rose 9% week over week, and the ethylene premium to ethane increased 11%. Propane prices decreased 5%, while Brent crude oil prices decreased 4% week over week, narrowing the propane discount to crude oil by 1%. Normal butane prices fell 5%, isobutane prices fell 3%, and natural gasoline prices fell 1%.
Daily spot prices by region are available on the EIA website.
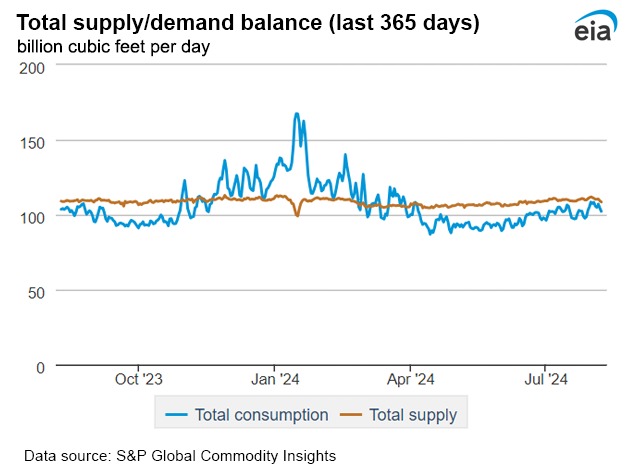
Supply and Demand
- Supply: According to data from S&P Global Commodity Insights, the average total supply of natural gas fell by 0.5% (0.5 Bcf/d) compared with the previous report week. Dry natural gas production decreased by 0.3% (0.3 Bcf/d) to average 103.2 Bcf/d, and average net imports from Canada decreased by 3.0% (0.2 Bcf/d) from last week.
- Demand: Total U.S. consumption of natural gas rose by 5.6% (4.2 Bcf/d) compared with the previous report week, according to data from S&P Global Commodity Insights. Natural gas consumed for power generation climbed by 9.0% (4.1 Bcf/d) week over week as temperatures across the United States were above normal. Consumption in the residential and commercial sector increased by 3.9% (0.3 Bcf/d), while industrial sector consumption decreased by 1.0% (0.2 Bcf/d) week over week. Natural gas exports to Mexico decreased 2.6% (0.2 Bcf/d). Natural gas deliveries to U.S. LNG export facilities (LNG pipeline receipts) averaged 12.6 Bcf/d, or 0.4 Bcf/d lower than last week.
Liquefied Natural Gas (LNG)
- Pipeline receipts: Average natural gas deliveries to U.S. LNG export terminals decreased 0.4 Bcf/d from last week to 12.6 Bcf/d, according to data from S&P Global Commodity Insights. Natural gas deliveries to terminals in South Louisiana decreased 3.3% (0.3 Bcf/d) to 7.4 Bcf/d, while natural gas deliveries to terminals in South Texas increased 2.9% (0.1 Bcf/d) to 4.2 Bcf/d. Natural gas deliveries to terminals outside the Gulf Coast decreased 12.1% (0.1 Bcf/d) to 1.0 Bcf/d.
- Vessels departing U.S. ports: Twenty-five LNG vessels (nine from Sabine Pass, four each from Corpus Christi and Freeport, three from Cameron, two each from Calcasieu Pass and Cove Point, and one from Elba Island) with a combined LNG-carrying capacity of 94 Bcf departed the United States between August 1 and August 7, according to shipping data provided by Bloomberg Finance, L.P.
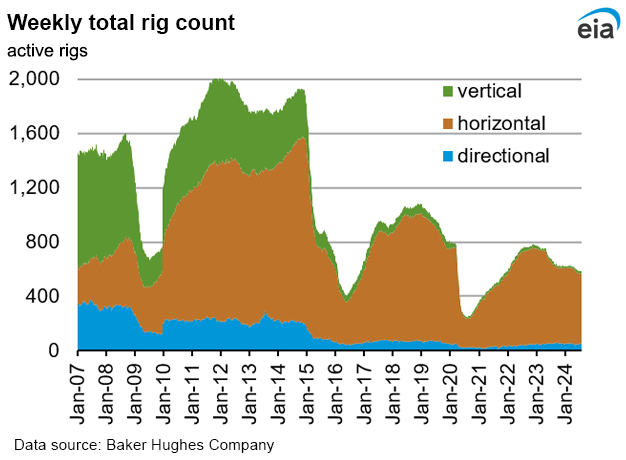
Rig Count
- According to Baker Hughes, for the week ending Tuesday, July 30, the natural gas rig count decreased by 3 rigs from a week ago to 98 rigs. The Haynesville and Marcellus each dropped one rig, and one rig was dropped among unidentified producing regions. The number of oil-directed rigs was the same as a week ago at 482 rigs. The DJ-Niobrara and Permian each dropped one rig, and two rigs were added among unidentified producing regions. The total rig count, which includes 6 miscellaneous rigs, now stands at 586 rigs, 73 fewer rigs than a year ago.
Storage
- Net injections into storage totaled 21 Bcf for the week ending August 2, compared with the five-year (2019–2023) average net injections of 38 Bcf and last year's net injections of 25 Bcf during the same week. Working natural gas stocks totaled 3,270 Bcf, which is 424 Bcf (15%) more than the five-year average and 248 Bcf (8%) more than last year at this time.
- According to The Desk survey of natural gas analysts, estimates of the weekly net change to working natural gas stocks ranged from net injections of 14 Bcf to 33 Bcf, with a median estimate of 27 Bcf.
- The average rate of injections into storage is 17% lower than the five-year average so far in the refill season (April through October). If the rate of injections into storage matched the five-year average of 9.6 Bcf/d for the remainder of the refill season, the total inventory would be 4,136 Bcf on October 31, which is 424 Bcf higher than the five-year average of 3,712 Bcf for that time of year.
See also:
Top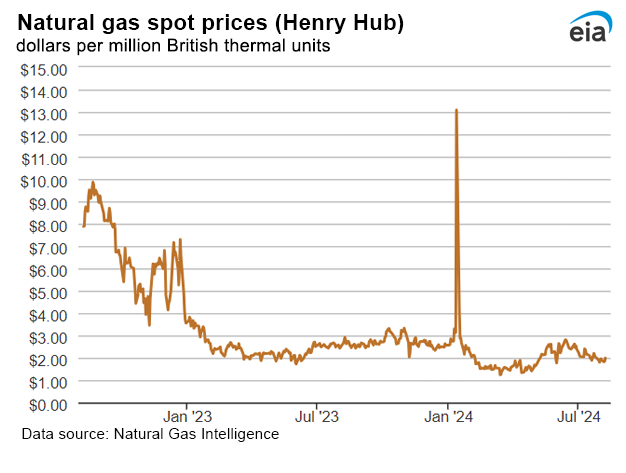
| Spot Prices ($/MMBtu) | Thu, 01-Aug |
Fri, 02-Aug |
Mon, 05-Aug |
Tue, 06-Aug |
Wed, 07-Aug |
|---|---|---|---|---|---|
| Henry Hub |
1.95 |
1.89 |
1.82 |
1.84 |
1.99 |
| New York |
1.70 |
1.65 |
1.41 |
1.37 |
N/A |
| Chicago |
1.83 |
1.74 |
1.71 |
1.73 |
1.76 |
| Cal. Comp. Avg.* |
2.73 |
2.54 |
2.57 |
2.47 |
2.26 |
| U.S. natural gas supply - Gas Week: (8/1/24 - 8/7/24) | |||
|---|---|---|---|
Average daily values (billion cubic feet) |
|||
this week |
last week |
last year |
|
| Marketed production | 117.0 |
117.4 |
116.7 |
| Dry production | 103.2 |
103.5 |
103.9 |
| Net Canada imports | 7.0 |
7.2 |
5.6 |
| LNG pipeline deliveries | 0.1 |
0.1 |
0.1 |
| Total supply | 110.2 |
110.7 |
109.6 |
|
Data source: S&P Global Commodity Insights | |||
| U.S. natural gas consumption - Gas Week: (8/1/24 - 8/7/24) | |||
|---|---|---|---|
Average daily values (billion cubic feet) |
|||
this week |
last week |
last year |
|
| U.S. consumption | 79.5 |
75.3 |
77.3 |
| Power | 49.4 |
45.3 |
47.2 |
| Industrial | 21.5 |
21.7 |
21.9 |
| Residential/commercial | 8.6 |
8.3 |
8.1 |
| Mexico exports | 6.8 |
6.9 |
6.7 |
| Pipeline fuel use/losses | 6.9 |
6.8 |
7.0 |
| LNG pipeline receipts | 12.6 |
12.9 |
12.2 |
| Total demand | 105.8 |
102.0 |
103.2 |
|
Data source: S&P Global Commodity Insights | |||
| Rigs | |||
|---|---|---|---|
Tue, July 30, 2024 |
Change from |
||
|
last week
|
last year
|
||
| Oil rigs |
482
|
0.0%
|
-8.2%
|
| Natural gas rigs |
98
|
-3.0%
|
-23.4%
|
| Note: Excludes any miscellaneous rigs | |||
| Rig numbers by type | |||
|---|---|---|---|
Tue, July 30, 2024 |
Change from |
||
|
last week
|
last year
|
||
| Vertical |
17
|
0.0%
|
-19.0%
|
| Horizontal |
520
|
-0.6%
|
-11.1%
|
| Directional |
49
|
0.0%
|
-7.5%
|
| Data source: Baker Hughes Company | |||
| Working gas in underground storage | ||||
|---|---|---|---|---|
Stocks billion cubic feet (Bcf) |
||||
| Region |
2024-08-02 |
2024-07-26 |
change |
|
| East |
719 |
711 |
8 |
|
| Midwest |
854 |
842 |
12 |
|
| Mountain |
257 |
253 |
4 |
|
| Pacific |
289 |
286 |
3 |
|
| South Central |
1,152 |
1,157 |
-5 |
|
| Total |
3,270 |
3,249 |
21 |
|
|
Data source: U.S. Energy Information Administration Form EIA-912, Weekly Underground Natural Gas Storage Report
Note: Totals may not equal sum of components because of independent rounding. | ||||
| Working gas in underground storage | |||||
|---|---|---|---|---|---|
Historical comparisons |
|||||
Year ago 8/2/23 |
5-year average 2019-2023 |
||||
| Region | Stocks (Bcf) |
% change |
Stocks (Bcf) |
% change |
|
| East |
694 |
3.6 |
641 |
12.2 |
|
| Midwest |
788 |
8.4 |
742 |
15.1 |
|
| Mountain |
195 |
31.8 |
178 |
44.4 |
|
| Pacific |
232 |
24.6 |
262 |
10.3 |
|
| South Central | 1,113 |
3.5 |
1,023 |
12.6 |
|
| Total | 3,022 |
8.2 |
2,846 |
14.9 |
|
| Data source: U.S. Energy Information Administration Form EIA-912, Weekly Underground Natural Gas Storage Report
Note: Totals may not equal sum of components because of independent rounding. |
|||||
| Temperature – heating & cooling degree days (week ending Aug 01) | ||||||||
|---|---|---|---|---|---|---|---|---|
HDDs |
CDDs |
|||||||
| Region | Current total |
Deviation from normal |
Deviation from last year |
Current total |
Deviation from normal |
Deviation from last year |
||
| New England | 1 |
-2 |
-3 |
52 |
7 |
9 |
||
| Middle Atlantic | 0 |
-2 |
-2 |
68 |
9 |
9 |
||
| E N Central | 0 |
-4 |
-1 |
64 |
7 |
4 |
||
| W N Central | 0 |
-3 |
0 |
90 |
19 |
4 |
||
| South Atlantic | 0 |
0 |
0 |
101 |
4 |
-1 |
||
| E S Central | 0 |
0 |
0 |
101 |
6 |
-5 |
||
| W S Central | 0 |
0 |
0 |
123 |
-3 |
-28 |
||
| Mountain | 0 |
-2 |
0 |
82 |
3 |
-12 |
||
| Pacific | 1 |
-1 |
1 |
49 |
1 |
-16 |
||
| United States | 0 |
-2 |
0 |
80 |
5 |
-4 |
||
|
Data source: National Oceanic and Atmospheric Administration Note: HDDs=heating degree days; CDDs=cooling degree days | ||||||||
Average temperature (°F)
7-day mean ending Aug 01, 2024
Data source: National Oceanic and Atmospheric Administration
Deviation between average and normal temperature (°F)
7-day mean ending Aug 01, 2024
Data source: National Oceanic and Atmospheric Administration
Monthly U.S. dry shale natural gas production by formation is available in the Short-Term Energy Outlook.