
This Week in Petroleum
Release Date: April 2, 2025
Next Release Date: April 9, 2025
Notice: Futures Prices after April 5, 2024, are not available.
-
Retail prices (dollars per gallon)
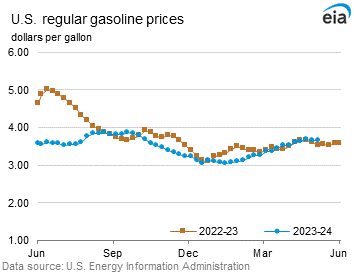
| Retail prices | Change from last | ||
|---|---|---|---|
| Gasoline | 03/31/25 | Week | Year |
| Click to chart this seriesU.S. | 3.162 | 0.047up-arrow | -0.355down-arrow |
| Click to chart this seriesEast Coast | 2.992 | 0.031up-arrow | -0.390down-arrow |
| Click to chart this seriesMidwest | 3.074 | 0.054up-arrow | -0.292down-arrow |
| Click to chart this seriesGulf Coast | 2.730 | -0.010down-arrow | -0.386down-arrow |
| Click to chart this seriesRocky Mountain | 3.111 | 0.068up-arrow | -0.240down-arrow |
| Click to chart this seriesWest Coast | 4.181 | 0.126up-arrow | -0.375down-arrow |
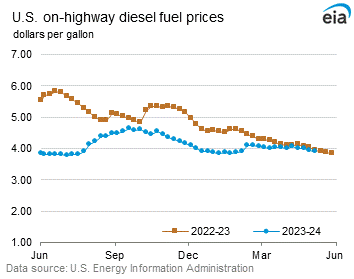
| Retail prices | Change from last | ||
|---|---|---|---|
| Diesel | 03/31/25 | Week | Year |
| Click to chart this seriesU.S. | 3.592 | 0.025up-arrow | -0.404down-arrow |
| Click to chart this seriesEast Coast | 3.695 | 0.020up-arrow | -0.388down-arrow |
| Click to chart this seriesMidwest | 3.519 | 0.028up-arrow | -0.430down-arrow |
| Click to chart this seriesGulf Coast | 3.282 | 0.017up-arrow | -0.388down-arrow |
| Click to chart this seriesRocky Mountain | 3.472 | 0.057up-arrow | -0.477down-arrow |
| Click to chart this seriesWest Coast | 4.259 | 0.030up-arrow | -0.392down-arrow |
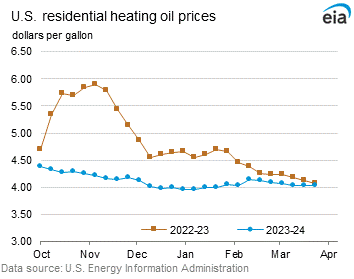
| Retail prices | Change from last | ||
|---|---|---|---|
| 03/31/25 | Week | Year | |
| Click to chart this seriesHeating Oil | 3.670 | -0.011down-arrow | NAno_change-arrow |
| Click to chart this seriesPropane | 2.690 | -0.005down-arrow | NAno_change-arrow |
-
Futures prices (dollars per gallon*)
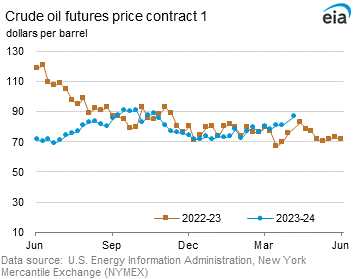
| Futures prices | Change from last | ||
|---|---|---|---|
| 03/28/25 | Week | Year | |
| Click to chart this seriesCrude oil | NA | NAno_change-arrow | NAno_change-arrow |
| Click to chart this seriesGasoline | NA | NAno_change-arrow | NAno_change-arrow |
| Click to chart this seriesHeating oil | NA | NAno_change-arrow | NAno_change-arrow |
| *Note: Crude oil price in dollars per barrel.
Futures Prices after April 5, 2024, are not available. |
|||
-
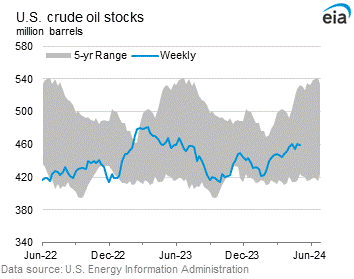
Stocks (million barrels)
| Stocks | Change from last | ||
|---|---|---|---|
| 03/28/25 | Week | Year | |
| Click to chart this seriesCrude oil | 439.8 | 6.2up-arrow | -11.6down-arrow |
| Click to chart this seriesGasoline | 237.6 | -1.6down-arrow | 9.8up-arrow |
| Click to chart this seriesDistillate | 114.6 | 0.3up-arrow | -1.4down-arrow |
| Click to chart this seriesPropane | 44.141 | 0.983up-arrow | -7.668down-arrow |