U.S. gasoline production is running near record levels
Note: Net production of motor gasoline reflects finished motor gasoline minus fuel ethanol.
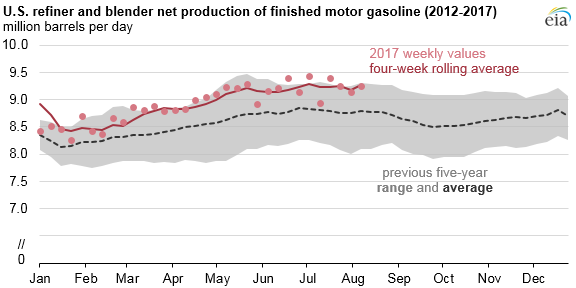
Gasoline production by U.S. refiners and blenders has run near record levels over the first seven months of 2017, with four-week rolling average production well above its five-year average and close to the top of its five-year range. U.S. gasoline inventories also remain relatively high despite growing domestic and foreign demand.
Growth in U.S. gasoline production since March is the result of record-high refinery runs. For the week ending April 21, 2017, U.S. refinery runs exceeded 17.5 million barrels per day (b/d) for the first time since EIA began publishing the weekly data series in 1990. Refinery runs have since exceeded this threshold eight additional times, reaching an all-time high of 17.9 million b/d the week ending on August 4, 2017. In 2016 about 47% of the input to refineries was converted to motor gasoline.
Net production of finished motor gasoline, which averaged 9.3 million b/d for the week ending August 11, reflects the unadjusted refiner and blender net production of finished motor gasoline less the use of fuel ethanol in order to isolate the petroleum component. This quantity is 191,000 b/d lower than the five-year high for early August but still more than 492,000 b/d higher than the previous five-year average.
Note: Previous five-year values reflect monthly series. 2017 values reflect weekly series.
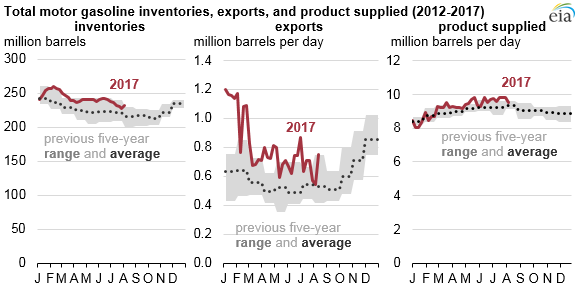
Despite historically high gasoline production levels, gasoline inventories have been declining because of above-average gasoline exports and domestic demand (EIA uses product supplied as a proxy for demand). However, gasoline inventories remain higher than the previous five-year average.
Total gasoline exports, including finished gasoline and blending components, are relatively small compared to domestic demand, averaging 761,000 b/d in 2016 compared with domestic product supplied of 9.3 million b/d. Estimated gasoline exports have remained relatively high so far in 2017, and as of August 11, were about 222,000 b/d higher than the previous five-year average.
Following a record-setting year in 2016, motor gasoline demand has remained relatively high in 2017. During the first half of the year, weekly product supplied remained lower than 2016 levels, but reached a record high of 9.84 million b/d for the week ending July 28 before declining to 9.52 million b/d the week ending August 11, 2017.
Crude oil prices over the past several months have been relatively stable compared with recent years. Since the first week of April, the difference between the highest and lowest prices of Brent crude oil over the previous 52 weeks has been less than $13 per barrel, the narrowest range since August 2014. Gasoline prices have also been relatively stable. As of August 7, the 52-week range for average U.S. regular retail gasoline prices was 30 cents per gallon, the narrowest 52-week range since March of 2004, with the exception of a two-week period in April when the 52-week range was one cent per gallon narrower.
EIA’s August Short-Term Energy Outlook forecasts that 2017 motor gasoline consumption will be virtually identical to 2016 levels, with product supplied expected to increase by less than 0.1%, to an average of slightly more than 9.3 million b/d for the year. By comparison, gasoline consumption in 2016 was 1.6% higher than 2015 levels. The flat forecast for gasoline consumption reflects slower expected growth in non-farm employment and an expected increase in the retail price of gasoline. Gasoline consumption in 2018 is expected to grow by 27,000 b/d (0.3%) from its projected 2017 level.
Principal contributor: Matthew French