Cross-market relationships strengthened in the third quarter of 2011

Note: Closing values at settlement times, 2:30 PM EST for near-month WTI futures prices and 4:00 PM EST for the S&P 500.
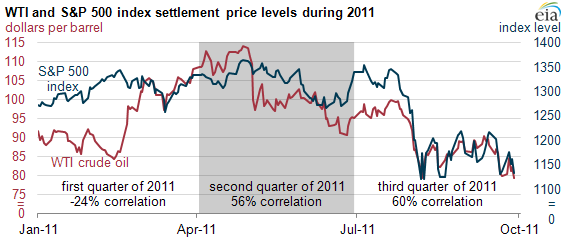
During the third quarter of 2011, correlations between the price movements of crude oil and other investments were at historically high levels. The correlation between prompt-month West Texas Intermediate (WTI) crude prices and the daily S&P 500 (S&P) index, a measure of the basket value of 500 stocks trading on the New York Stock Exchange and NASDAQ Stock Exchange, has been at elevated levels since this spring. Since April 2011, correlations between the daily prompt-month WTI futures price and the S&P index averaged almost 60%.
As highlighted in a recent Today in Energy article, these two markets also provide an example of how specific market practices can affect relationship levels.
After heightened correlation levels during and after the global recession of 2008, the relationship between oil and stocks weakened in the first three months of 2011. During this period, instability in the Middle East and North Africa contributed to rising oil prices. Because of the decrease in world crude supply, stock prices retreated, partially due to fears of high oil prices affecting economic growth. After these events, however, daily price changes returned to their previous and recent trend of shared movements. This high positive correlation during the third quarter of 2011, and similarly in the second, came during a period of increased concern about the world economy. Price levels for both crude oil and stocks generally fell during these months as growth expectations were revised down.
Variations on the correlation metrics:
Other crude benchmarks: The relatively close relationship between the S&P index and near-month WTI futures prices occurred despite the WTI market diverging from other world crude oil benchmarks. Differences between prices for WTI and other crude oil benchmarks set record highs during the third quarter of 2011; at one point these differences accounted for about one-quarter of the underlying near-month WTI price. This large differential, however, does not appear to have affected the relative movement of WTI prices. In fact, the correlation between WTI and the S&P index was higher this year than that between Brent, another commonly used oil benchmark, and the S&P. This may be due to the widespread use of WTI as a financial investment (a function similar with stock indices), or because WTI and the S&P index are both U.S.-based assets.
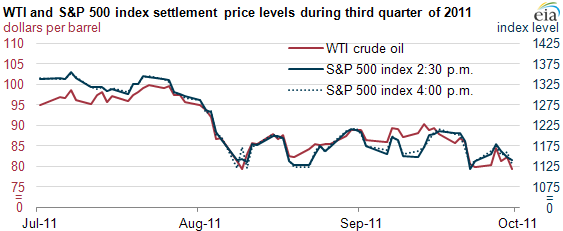
Other price comparisons: The correlation levels outlined above may actually under-represent how strong the linkages have been between the WTI near-month futures and equity prices. The initial price change comparisons were based on daily settlement levels for the two markets. However, the two markets settle at different times of the day; the NYMEX WTI futures contract settles at 2:30 p.m. Eastern Standard Time whereas the S&P index settles later, at 4:00 p.m. Eastern Standard Time.
During periods of low market volatility, this 90-minute gap likely would not result in noticeable settlement differences. However, in the third quarter of 2011, on multiple trading days, there were large stock price movements between 2:30 p.m. and 4:00 p.m. (see the separation in the red line and dashed blue line below in the chart). For instance, on September 9, the S&P index gained 4 percent after the NYMEX WTI futures contract closed at 2:30 p.m. By comparing the WTI price and S&P index change at the same market close time (2:30 p.m.) the correlation between them (the red line and solid blue line) rose to 75%. For further information about recent relationships between crude oil and other asset classes, please refer to EIA's What Drives Crude Oil Prices? website.

Note: Closing values at settlement times, 2:30 PM EST for near-month WTI futures prices and 4:00 PM EST for the S&P 500.