2024 was a year of notable accomplishments. Check out the highlights of EIA products and programs this year.
Extreme cold in the Midwest led to high power demand and record natural gas demand

Extreme cold weather in the Midwest at the end of January led to high—but not record-setting—electricity load on Wednesday, January 30, 2019, the coldest day of the period, on the Midcontinent Independent System Operator (MISO) grid. However, consumption of natural gas, the main fuel used for heating in the region, reached estimated record levels on the same day. Natural gas and electricity prices were elevated but did not reach levels seen during previous cold weather events in recent years.
Compared with the 2018 bomb cyclone and the 2014 polar vortex weather events, the January 2019 polar vortex was significantly colder, with Upper Midwest temperatures dropping to as low as -20 to -45 degrees Fahrenheit. However, hourly electricity load in MISO peaked at 100.9 gigawatts (GW) on January 30, 2019, based on preliminary data, compared with 100 to 104 GW during the 2018 bomb cyclone and MISO’s all-time winter peak of 109.3 GW reached during the 2014 polar vortex.
Peak electricity loads during the 2019 event were lower than expected because of the deployment of load-modifying resources in MISO (which includes demand response and behind-the-meter generation), other voluntary load management actions, and the wide closure of schools and businesses, which reduced non-residential sector electricity demand.
In contrast to electricity demand, an estimated record amount of natural gas was consumed by the residential/commercial sector (26.1 billion cubic feet (Bcf)) and overall (37.9 Bcf) in the Midwest on January 30, 2019, when many people stayed home. Natural gas is the main fuel used in the region for residential and commercial space heating.
Midwest natural gas withdrawals from storage for the week ending February 1, 2019, contributed to the largest net withdrawal of working natural gas in the Lower 48 states so far during the 2018–2019 heating season.
During times of transmission grid stress, regional transmission organizations such as MISO have a defined set of escalating steps, usually called emergency operating procedures, they can take to avoid or minimize the impact of the event. During the late January cold, MISO took several operational steps to maintain system reliability, including suspending inessential equipment maintenance, implementing emergency energy pricing measures to accurately reflect grid conditions in its markets, curtailing non-firm energy exports out of MISO, and implementing load management measures.

Despite greater natural gas consumption in the 2019 event, natural gas prices were lower compared with previous weather events. Day-ahead natural gas spot prices reached $7.42 per million British thermal units (MMBtu) at Chicago, the main hub in the region, $4.12/MMBtu at the Consumers Energy Citygate hub serving the Michigan area, and $6.51/MMBtu at the Northern Natural Gas (NNG) Ventura hub serving the Minnesota area.
During the 2018 bomb cyclone, NNG Ventura spiked to more than $60/MMBtu as high demand led to concerns of low natural gas inventories, while other hubs remained lower than $10/MMBtu. During January 2014, prices reached $30 to $45/MMBtu.
Power price movements were similarly more muted in the 2019 event, with Upper Midwest day-ahead on-peak electricity prices reaching $300 to $415 per megawatthour (MWh) in January 2014, $100 to $150/MWh in January 2018, and $95 to $120/MWh in January 2019.

Source: U.S. Energy Information Administration, based on MISO

Source: U.S. Energy Information Administration, based on MISO

Source: U.S. Energy Information Administration, based on MISO
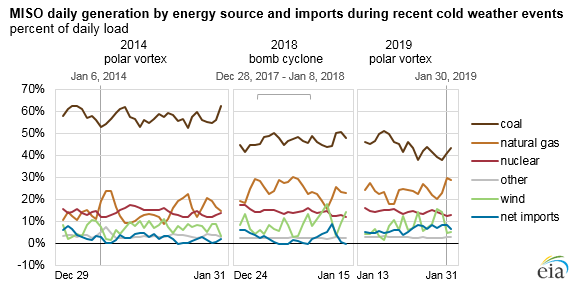
On January 30, coal supplied about 41% of MISO’s load and natural gas supplied about 30%. Natural gas provided about the same share during last year’s bomb cyclone while coal provided a higher share, about 45% to 50%. During the 2014 polar vortex, coal was substantially higher, supplying more than 50% of load while natural gas ranged from 10% to 25%.
Nuclear supplied about 12% to 15% of load during all three winter events. Wind supplied a daily average of 7%, ranging from 1% to 13%, during the previous two events. On January 30, 2019, wind accounted for an average of 5%, ranging from 5% to 15% on surrounding days. Wind generation dropped off on the evening of January 29, 2019, mainly caused by wind plants reaching their cold weather cutoff thresholds.
Total unplanned generator outages were about 30 GW on January 30, 2019, which was higher than the 20–28 GW range during previous winter events.
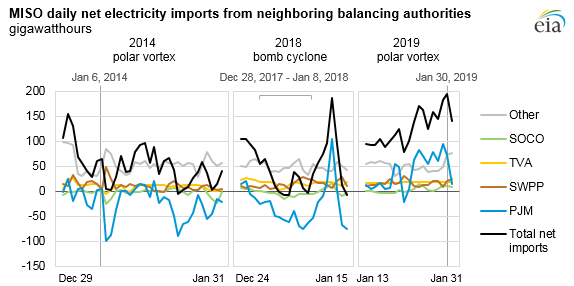
Electricity imports into MISO played a bigger role this year, supplying about 9% of load on January 30, compared with 0% to 3% in the previous two events. These imports came primarily from PJM Interconnection (PJM) to the east.
Principal contributor: April Lee
Tags: prices, residential, commercial, generation, consumption/demand, coal, electricity, natural gas, nuclear, spot prices, electric generation, weather, Midwest, renewables, wind, electricity generating fuel mix, exports/imports, power plants, ISO (independent system operator), resources, RTO (regional transmission organization), wholesale prices, Illinois, states, wholesale power, North Dakota, Michigan, electric power grid