
February’s increase in coal-fired electric generation reduced U.S. coal stockpiles
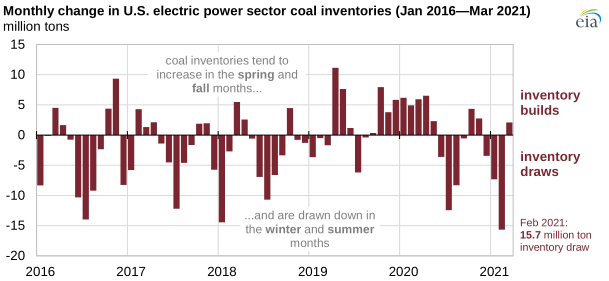
Coal stockpiles at U.S. power plants decreased significantly from December 2020 to February 2021, including a draw of nearly 16 million tons in February 2021. February’s draw was the largest monthly coal inventory decrease since July 2011, when stocks were drawn down by 18 million tons.
Plants stockpile coal to ensure fuel supply; they generally build up inventory to prepare for periods of greater demand and draw from the stockpile as needed. Typically, most large coal stock draws have occurred during the summer, when coal-fired generation is at its greatest. Heavy inventory draws are less common in the winter unless extreme weather events occur, such as the February 2021 winter storm in Texas and neighboring states.
From December 2020 to February 2021, coal stockpiles at U.S. power plants decreased as coal-fired electricity generation increased. Rising natural gas prices in late 2020 and early 2021 made coal-fired electricity generation more competitive. The United States saw 16% more coal-fired generation in December 2020 and January 2021 than it did in December 2019 and January 2020, as coal displaced natural gas-fired generation in some markets. Coal-fired generation continued to increase in February 2021, when a winter storm elevated electricity demand.
In addition to surveying coal stockpile levels, we calculate how long these stockpiles would last if the power plants received no additional coal. This value, known as days of burn, considers each plant’s current stockpile level and its past consumption patterns.
Because coal-fired power plants use different types of coal, we track this data based on these coal types. The two main types of coal used for electricity generation in the United States are bituminous coal, which is mostly produced in West Virginia, Illinois, and Pennsylvania, and subbituminous coal, which is mostly produced in Wyoming.
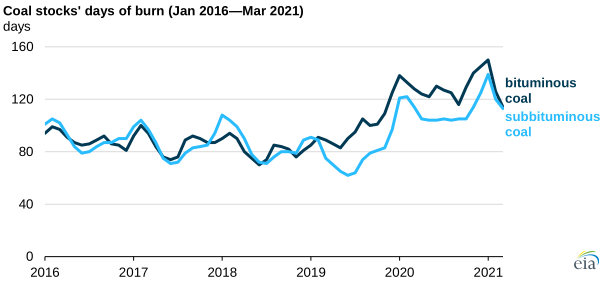
U.S. bituminous coal plants had an average of 150 days of burn in January 2021, the most days of burn since we started tracking this data in 2010. Following significant coal stock draws, the average days of burn decreased to 114 days in March 2021. For U.S. subbituminous coal plants, the average days of burn decreased from a record high of 139 days in January 2021 to 113 days in March.
Utilities often have fixed contracts for coal deliveries, so inventories can build up if they generate less electricity than expected. Reduced electricity demand because of responses to COVID-19, in addition to relatively low prices for natural gas, contributed to less coal generation for much of 2020. As a result, coal stocks’ average days of burn increased to the record highs seen in January 2021.
Principal contributors: Paul McArdle, Elesia Fasching
Tags: generation, coal, electricity, inventories/stocks