
Energy use for transportation increased from pre-pandemic levels in 2021 in only 12 states
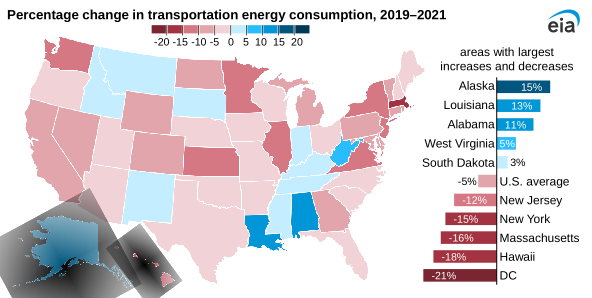
Use of energy for transportation remained low in the United States during 2021 compared with pre-pandemic levels and only increased in 12 states. Average U.S. transportation energy use decreased by 5% from 2019 to 2021, according to our State Energy Data System (SEDS). Although transportation energy use did increase in every state in 2021 compared with 2020, transportation in the majority of states still remained below 2019 pre-pandemic levels in 2021.
Our transportation sector estimates encompass energy used by vehicles to transport people and goods from one place to another, such as cars, trucks, trains, planes, and boats.
Transportation energy use increased 15% in Alaska, the largest percentage increase of any state from 2019 to 2021, mostly because of increased jet fuel use for air travel. Alaska is a major fueling stop for military, cargo, and commercial flights between North America and Asia. In 2021, jet fuel use in Alaska increased by 36% compared with 2019, the largest state-level increase, as passenger and cargo traffic exceeded pre-pandemic levels.
In Louisiana, increased use of petroleum for large marine vessels drove the second-largest increase in transportation energy use (13%), largely because of changes in shipping technology to meet international regulations. In 2021, residual fuel oil use in Louisiana, a major shipping hub along the Gulf of Mexico, more than doubled compared with 2019. Residual fuel oil is a petroleum product commonly used by international vessels. U.S. demand for residual fuel oil rose in 2021, increasing by 16% compared with 2019, in part because vessels added scrubber technology to reduce sulfur emissions and meet international standards.
Transportation energy use increased by 11% in Alabama in 2021 compared with 2019, largely because of more motor gasoline used for car travel. Although motor gasoline use in most states remained about 6% lower on average nationwide in 2021 than in 2019, motor gasoline use increased in Alabama, South Dakota, Montana, Idaho, Maine, New Mexico, Indiana, and Missouri.
The largest drop in energy use for transportation was in the District of Columbia (DC), where transportation energy use decreased by 21% in 2021 compared with 2019 because of less petroleum used by vehicles and less electricity use by its subway system. In 2021, DC’s use of diesel for trucks was down 35%, and motor gasoline for cars was down 14% compared with 2019. Electricity use for transportation in DC was down 22% over the same period in part because ridership on Metrorail (the third-largest subway system in the United States) remained 75% lower than pre-pandemic levels.
Energy use for transportation decreased by 18% in Hawaii in 2021 compared with 2019, mostly because less jet fuel was used for planes. Jet fuel accounts for more total petroleum use in Hawaii than any other state except Alaska because of its large commercial and military air travel economy. Jet fuel use in Hawaii was 24% lower in 2021 than in 2019.
Principal contributors: Mickey Francis, Sheila Hayati