
China’s natural gas consumption, production, and imports all increased in 2023
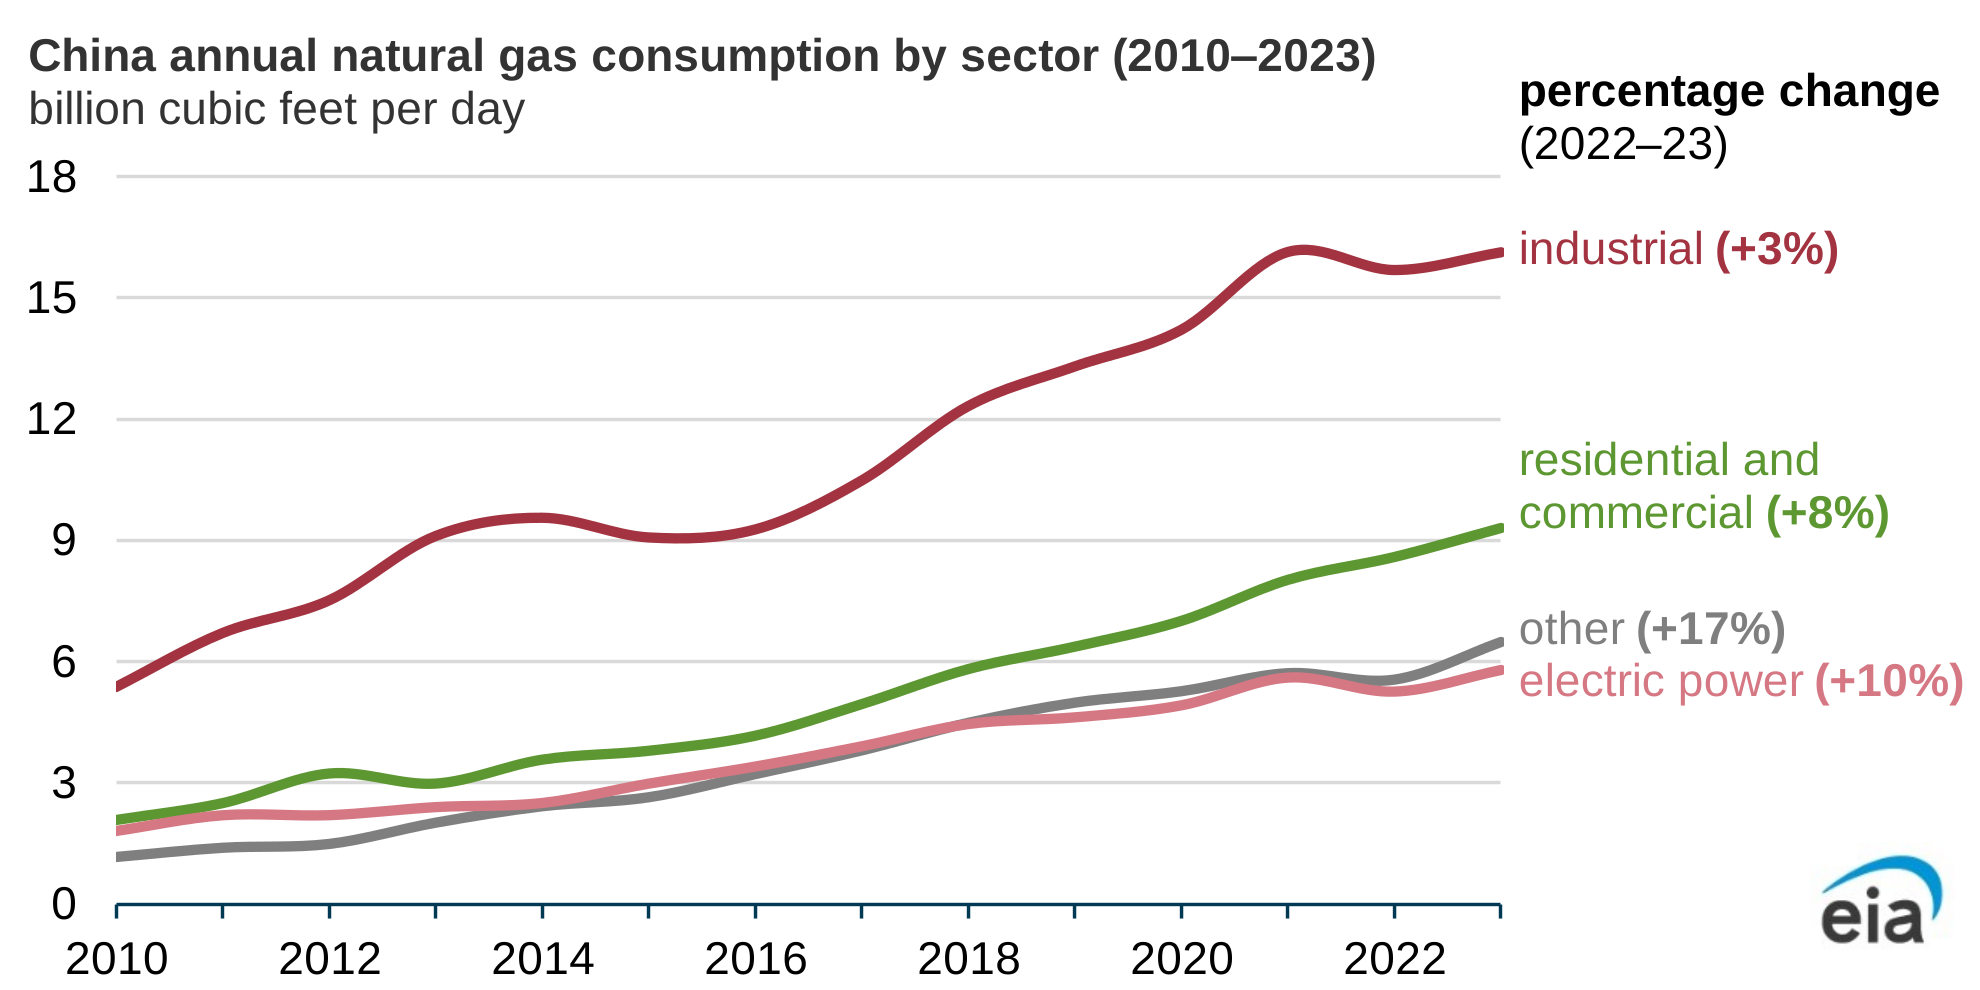
Note: Industrial consumption includes natural gas feedstock. Other includes district heating and transport.
In 2023, 7%, or 2.6 billion cubic feet per day (Bcf/d), more natural gas was consumed in China than in 2022, after a decline of 1.1% in 2022 when economic growth was slower, mainly due to China’s zero-COVID policies, leading to a reduction in natural gas consumption.
Last year, annual natural gas consumption increased in all economic sectors within China, with residential and commercial consumption increasing by 8%, or 0.7 Bcf/d, and electric power consumption increasing by 10%, or 0.5 Bcf/d. Residential and commercial natural gas consumption in China has grown every year since 2014, almost tripling from 3.6 Bcf/d in 2014 to 9.3 Bcf/d in 2023, as more customers switched from coal to natural gas for home heating. In the electric power sector, additional economic activity and new natural gas-fired capacity increased consumption.
Domestic natural gas production in China provided 58% of its natural gas supply in 2023, averaging 21.7 Bcf/d, an increase of 6% (1.2 Bcf/d) from 2022. Domestic production has grown by more than 1.0 Bcf/d every year since 2017, mainly from discrete natural gas reservoirs and associated natural gas from oil production. Production from low-permeability formations, such as tight gas, shale, and coal-bed methane, has also increased and averaged 8.6 Bcf/d in 2023. China’s 14th Five-Year Plan (2021–25) set a domestic natural gas production target of 22.3 Bcf/d by 2025, most of which was met in 2023.
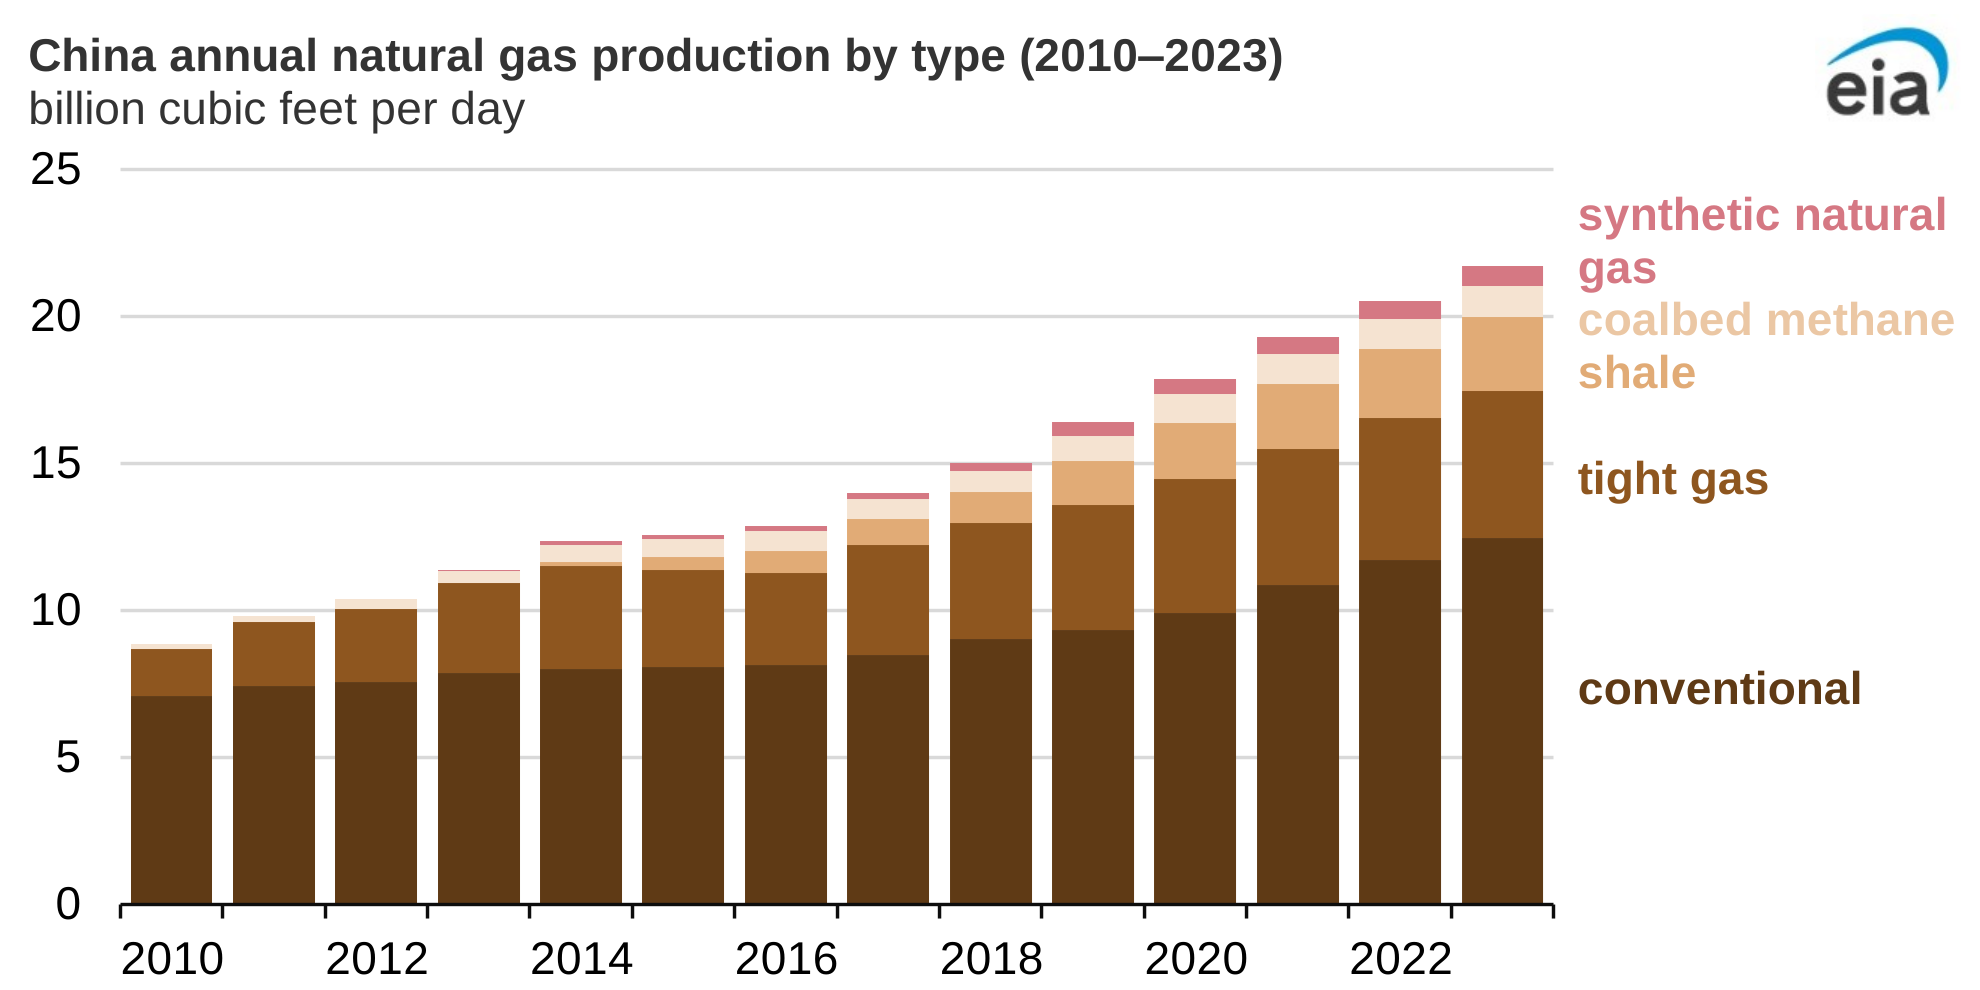
Note: Conventional includes production from discrete natural gas reservoirs and associated natural gas. China's domestic production grew at a compound annual growth rate of 7% between 2010 and 2023.
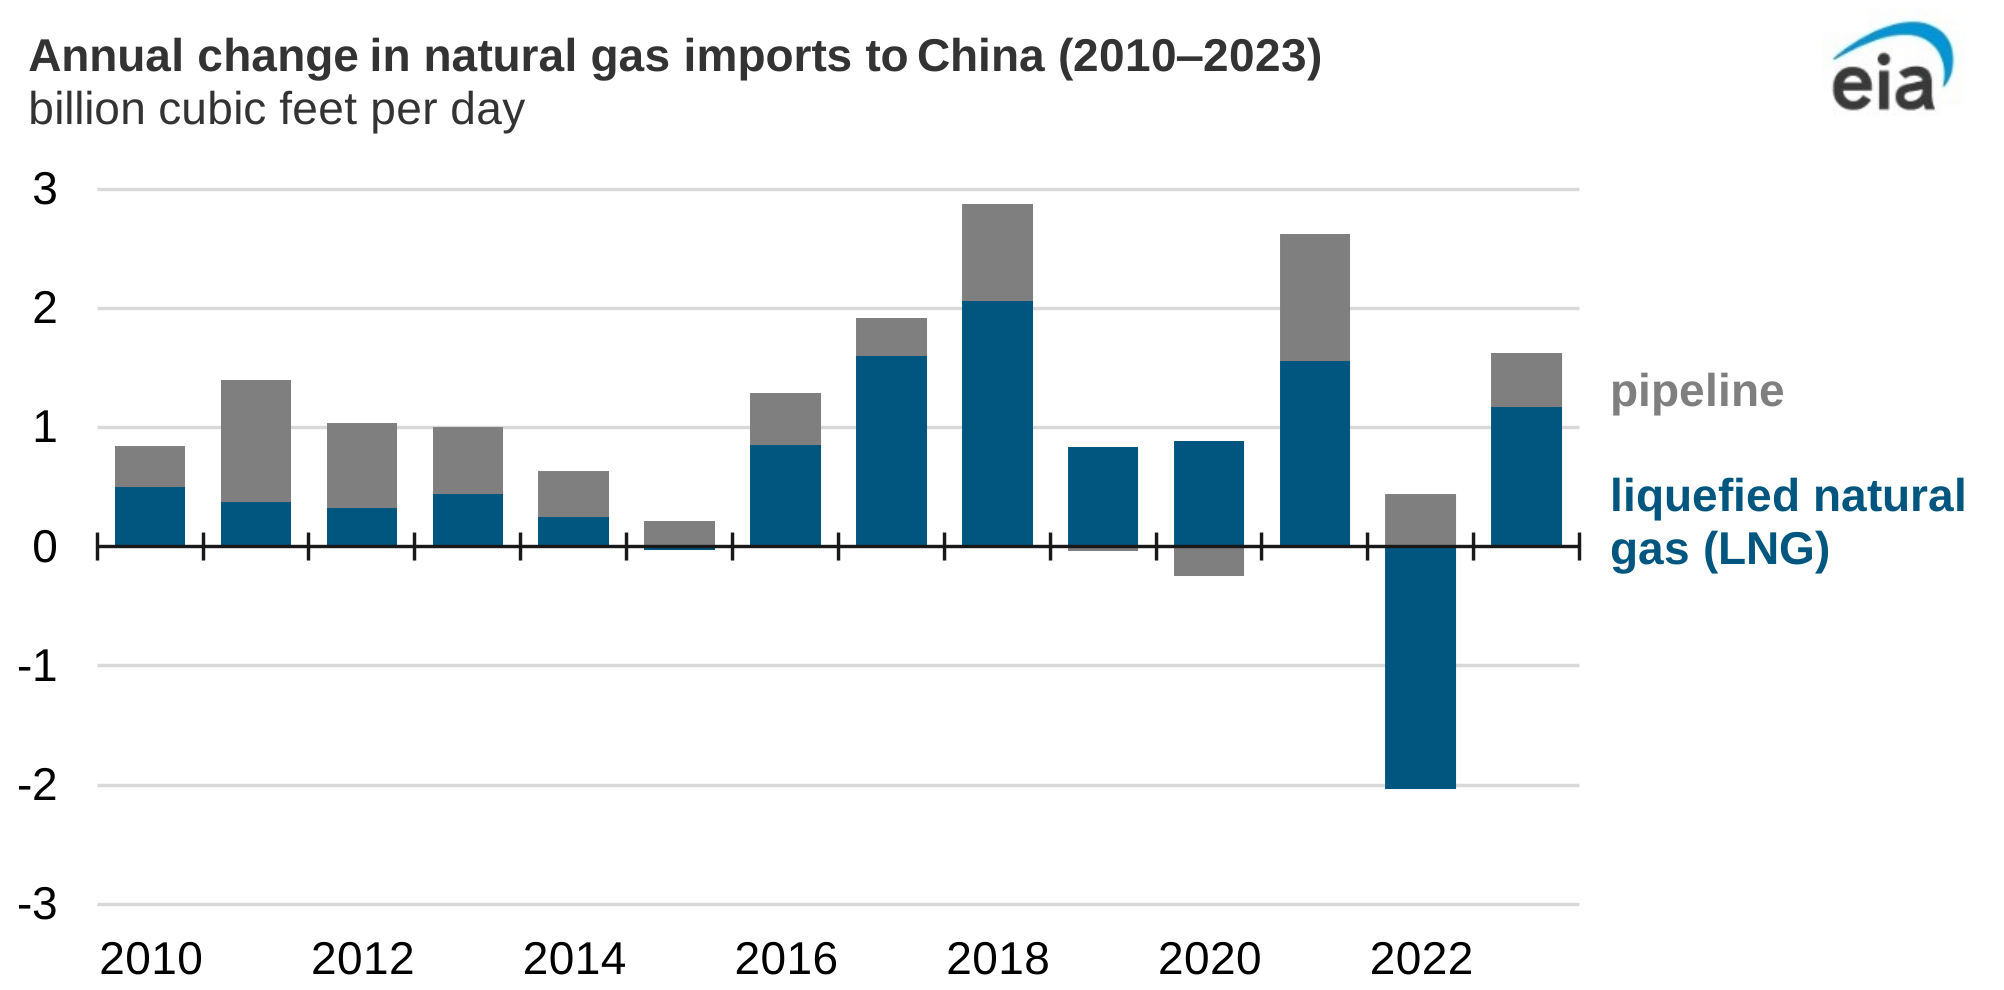
In 2023, China’s natural gas imports averaged 16.0 Bcf/d and accounted for 42% of China’s total natural gas supply, compared with 15% of its supply in 2010. Natural gas is imported into China by pipeline and as liquefied natural gas (LNG).
China became the world’s largest LNG importer in 2023, the second time since 2021. In 2023, China’s LNG imports averaged 9.5 Bcf/d, an increase of 13% from 2022, according to data from China’s General Administration of Customs. Last year, the countries supplying the most LNG to China were Australia (34% of total LNG imports), Qatar (23%), Russia (11%), and Malaysia (10%).
Annual imports by pipeline increased by 6% in 2023, averaging 6.5 Bcf/d. Pipeline imports increased mainly from Russia via the Power of Siberia 1 pipeline, which continued to ramp up to full production, with a target to reach 3.7 Bcf/d in export flows by 2025. A second pipeline from Russia to China—Power of Siberia 2 with a proposed design capacity of 4.8 Bcf/d—is currently in the planning phase.
Principal contributors: Victoria Zaretskaya, Faouzi Aloulou