|
Download Data (XLS File) |

|
||||||||
 |
||||||||
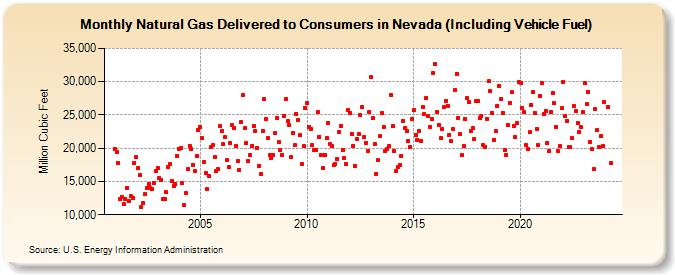
| Natural Gas Delivered to Consumers in Nevada (Including Vehicle Fuel) (Million Cubic Feet) | ||||||||
| Year | Jan | Feb | Mar | Apr | May | Jun | Jul | Aug | Sep | Oct | Nov | Dec |
|---|---|---|---|---|---|---|---|---|---|---|---|---|
| 2001 | 19,952 | 19,433 | 17,795 | 12,312 | 12,723 | 11,650 | 12,329 | 14,023 | 12,067 | 12,854 | 12,525 | 17,842 |
| 2002 | 18,621 | 16,951 | 15,943 | 11,123 | 11,789 | 13,044 | 14,033 | 14,618 | 13,988 | 13,798 | 14,840 | 16,521 |
| 2003 | 17,053 | 15,548 | 15,238 | 12,410 | 12,410 | 13,355 | 17,113 | 17,666 | 15,088 | 14,301 | 14,598 | 18,798 |
| 2004 | 19,886 | 20,030 | 14,760 | 11,514 | 13,220 | 16,819 | 20,333 | 19,864 | 17,480 | 16,556 | 18,897 | 22,720 |
| 2005 | 23,220 | 21,494 | 17,907 | 16,239 | 13,790 | 15,823 | 20,156 | 20,490 | 18,633 | 16,596 | 16,816 | 23,279 |
| 2006 | 22,656 | 20,590 | 21,653 | 18,176 | 17,142 | 20,713 | 23,453 | 23,014 | 20,275 | 18,099 | 16,784 | 23,869 |
| 2007 | 28,060 | 22,975 | 20,736 | 18,036 | 18,941 | 20,292 | 23,367 | 22,531 | 20,095 | 17,304 | 16,144 | 22,538 |
| 2008 | 27,453 | 24,386 | 21,473 | 18,925 | 18,584 | 18,959 | 22,226 | 24,521 | 20,966 | 19,767 | 19,038 | 24,842 |
| 2009 | 27,429 | 24,045 | 23,552 | 18,684 | 22,306 | 20,407 | 25,176 | 24,297 | 21,935 | 17,654 | 20,301 | 25,993 |
| 2010 | 26,743 | 23,184 | 22,916 | 20,434 | 19,675 | 19,668 | 25,384 | 21,739 | 18,963 | 17,014 | 19,031 | 21,505 |
| 2011 | 23,812 | 20,637 | 20,336 | 17,481 | 17,676 | 18,340 | 22,479 | 23,383 | 19,802 | 18,483 | 17,684 | 25,693 |
| 2012 | 25,280 | 22,161 | 20,389 | 17,377 | 21,426 | 22,097 | 24,957 | 26,124 | 21,680 | 20,818 | 19,517 | 25,416 |
| 2013 | 30,640 | 24,472 | 20,564 | 16,169 | 18,186 | 21,828 | 25,268 | 23,214 | 19,510 | 19,931 | 20,296 | 27,930 |
| 2014 | 23,407 | 19,644 | 16,540 | 17,186 | 17,493 | 18,783 | 24,130 | 22,959 | 22,615 | 21,065 | 20,230 | 24,322 |
| 2015 | 25,728 | 22,056 | 21,303 | 22,535 | 21,097 | 26,234 | 25,168 | 27,596 | 24,802 | 23,259 | 24,391 | 31,266 |
| 2016 | 32,635 | 25,494 | 23,474 | 21,472 | 22,893 | 26,162 | 27,115 | 26,392 | 22,053 | 21,065 | 22,879 | 28,689 |
| 2017 | 31,225 | 24,571 | 22,107 | 18,971 | 20,347 | 24,322 | 27,545 | 26,896 | 22,606 | 22,979 | 21,426 | 27,073 |
| 2018 | 27,128 | 24,569 | 24,861 | 20,475 | 20,174 | 24,445 | 30,042 | 28,560 | 25,361 | 21,241 | 22,585 | 26,396 |
| 2019 | 29,406 | 27,412 | 25,349 | 19,699 | 19,028 | 23,473 | 26,856 | 28,384 | 23,313 | 21,649 | 23,796 | 29,881 |
| 2020 | 29,775 | 25,967 | 25,430 | 20,405 | 19,886 | 22,429 | 26,542 | 28,415 | 25,332 | 22,948 | 20,456 | 27,845 |
| 2021 | 29,747 | 25,160 | 25,604 | 20,832 | 19,552 | 25,474 | 28,238 | 26,735 | 23,140 | 19,534 | 20,271 | 25,997 |
| 2022 | 29,991 | 24,760 | 24,144 | 20,102 | 20,145 | 21,425 | 26,248 | 25,397 | 23,695 | 22,419 | 23,029 | 25,266 |
| 2023 | 30,336 | 27,201 | 29,009 | 21,387 | 20,175 | 17,173 | 26,158 | 22,974 | 20,454 | 22,128 | 20,645 | 27,413 |
| 2024 | 31,737 | 26,282 | 22,170 | 18,040 | 18,554 | 21,626 | 27,252 | 24,034 | 21,506 | 21,656 | 20,801 | 25,463 |
| 2025 | NA | |||||||||||
| - = No Data Reported; -- = Not Applicable; NA = Not Available; W = Withheld to avoid disclosure of individual company data. |
| Release Date: 3/31/2025 |
| Next Release Date: 4/30/2025 |